
Table of Contents
Table of Contents
During an overnight shift, an Apache Kafka on-call alert rarely says “the fetch path is unhealthy.” It says that checkout events are late, a Consumer group is falling behind, Producers are timing out, or a Broker disk is nearly full. The operator knows the symptom because the symptom woke them up. They do not yet know which component owns it.
That distinction changes the first hour. Starting with a component sends the responder through broker, controller, storage, and network dashboards before the incident has been scoped. Starting with the symptom creates a shorter test: state a plausible hypothesis, check three metrics, and decide whether the evidence supports that path.
The working rule is: protect recovery first, then prove the root cause. Use the same loop for six common symptoms, and keep every mitigation reversible.
1Why component-first debugging wastes the first hour
Kafka is a distributed system, so many components can be healthy while the user-visible path is failing. A broker can accept produce requests while a downstream Consumer falls behind, and a stable Consumer group can still have one hot Partition. A disk alert can be accurate while retention, placement, or a replay storm explains it. Looking at a component first gives you true facts, but not necessarily a decision.
The better starting point is the first observable change in the business path. Record the timestamp when the symptom began, the affected Topic or Consumer group, the scope of the impact, and the last deployment or configuration change before it. Then ask which part of the path could have changed: input rate, partition distribution, client processing, broker request handling, storage access, network placement, or metadata coordination.
This ordering matters during recovery. A restart can clear a stuck client but hide a rebalance loop. Adding Consumers can drain a backlog when there are free Partitions, but overload a database or do nothing for one hot Partition. Expanding a volume can stop an alert while leaving retention or placement untouched. The first action should buy time and preserve evidence, not commit the team to a theory.
2A symptom-first framework: hypothesis, three metrics, verdict
Symptom -> hypothesis -> three metrics -> verdict -> reversible action
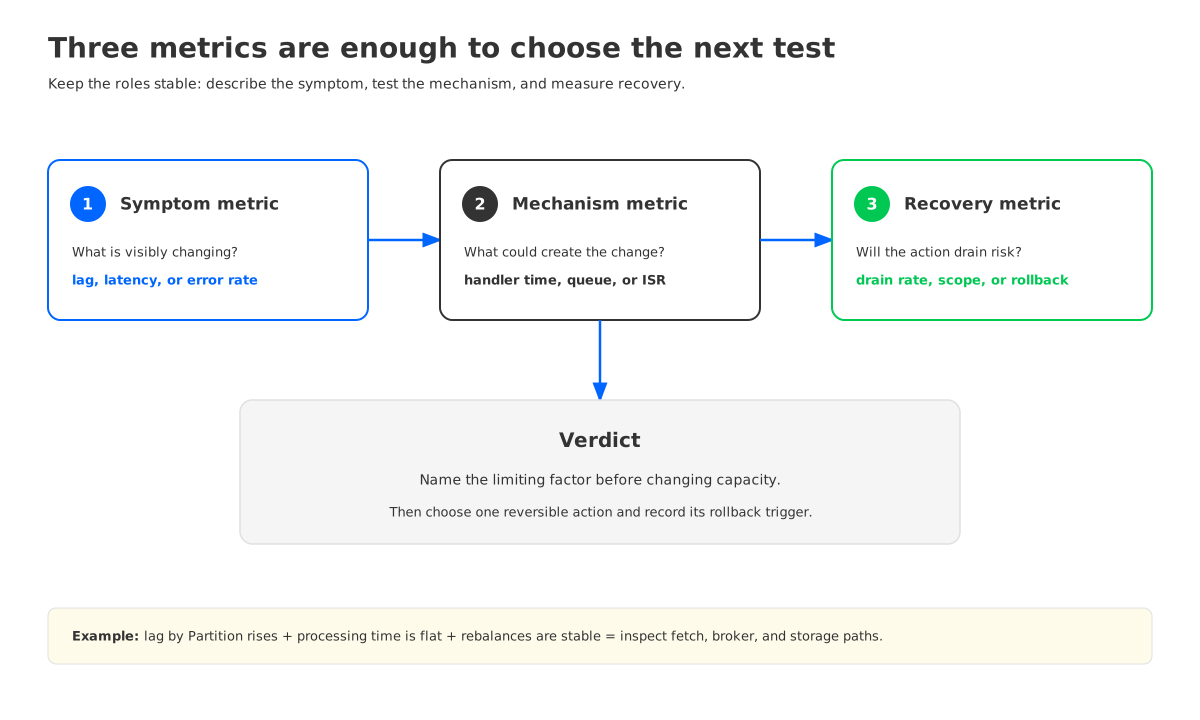
The three metrics are a forcing function, not a universal magic number. One describes the alarm, one tests the suspected mechanism, and one shows the blast radius or recovery path. That is usually enough to choose a next step without opening every dashboard. Use the Apache Kafka documentation for configuration and operational semantics, then map the same questions to the metrics exposed by your deployment.
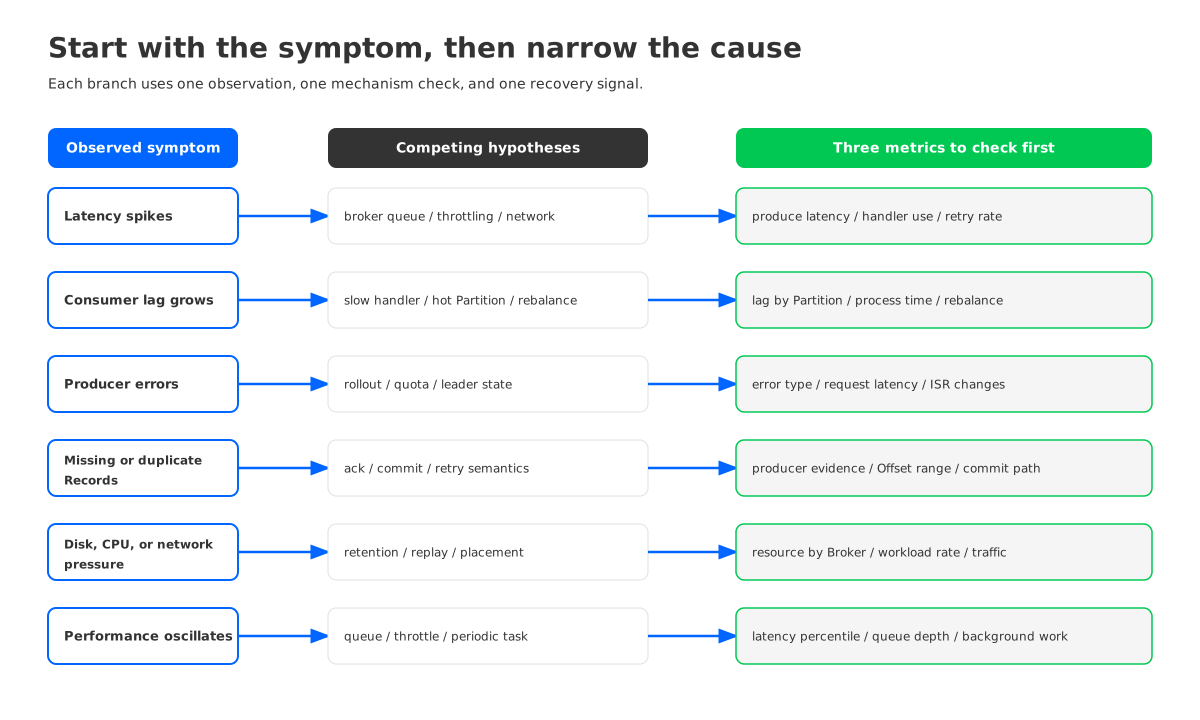
For example, “Consumer lag is rising” is an observation, not a diagnosis. Check lag by Partition, Consumer processing time or fetch latency, and group membership or rebalance activity. One lagging Partition points toward key distribution or per-Partition work; group-wide lag with flat processing time points toward fetch service, broker pressure, network, or downstream capacity. The verdict should name the limiting factor before the mitigation changes it.
3Six symptoms and where they usually come from
The symptom determines the first branch. These are starting points, not replacement diagnoses.
3.1“Kafka is slow” or produce latency spikes
Separate end-to-end latency from throughput. A producer may be waiting for broker request handling, acknowledgement conditions, throttling, network retransmission, or the selected durability path. Check produce request latency, request queue or handler utilization, and producer error or retry rate. If latency rises with handler saturation and retries, the broker path is under pressure. If handler utilization is stable but network errors rise, inspect the client-to-broker path and recent routing changes. If both are stable, compare the producer's batching and acknowledgement settings with the workload change.
The safe response is to preserve the timeline and reduce the source of pressure when the producer can do so. Do not increase batch size or timeout values as a reflex; those changes can make the queue longer while making the graph look quieter. A latency problem becomes a capacity problem only after the evidence shows that the existing path cannot serve the requested rate.
3.2Consumer lag grows
Start with lag by Partition, Consumer processing time, and rebalance count or duration. A single lagging Partition points toward key skew, a poison Record, or work that cannot be parallelized. Lag across the group with high processing time points toward application or downstream capacity. Lag that grows around repeated rebalances points toward membership churn, session behavior, deployments, or a client failure loop.
The recovery test is the drain rate. Once the trigger is removed, is the group catching up faster than new Records arrive? Add Consumers only when the Topic has more usable Partitions and the downstream system can accept the extra work. If fetch latency is the outlier, inspect broker, storage, and network evidence before changing the group. The Apache Kafka consumer configuration reference is useful for checking client settings without treating a setting name as a diagnosis.
3.3Producer timeouts or delivery errors rise
A delivery error can happen before the Broker accepts a Record, while it waits in the request path, or after a durability or acknowledgement condition is not met. Check error type by Producer, produce request latency, and ISR (In-Sync Replicas) or leader-change activity. Pair those with the Producer deployment timeline. Authentication, serialization, quota, and network failures need different owners from Broker saturation or replication pressure.
Avoid the broad action of restarting every producer. Stop or roll back the producer release that introduced the error when the timeline supports it, and preserve a sample of the error type and affected Topic. If the error is tied to leader changes, partition availability, or replication state, the platform team should stabilize the cluster before asking applications to retry harder.
3.4Records look missing, duplicated, or out of order
This symptom needs a boundary before a component. Define whether the Record was never produced, was accepted but not committed by the Consumer, was filtered by application logic, or was written twice after a retry. Check producer acknowledgement and error logs, committed versus end Offset, and Consumer retry or commit behavior. For suspected duplicates, compare producer identity and sequence behavior with the application’s idempotency handling. For suspected loss, preserve the Topic, Partition, Offset range, key, and timestamp before retention or compaction changes the evidence.
The common mistake is to call every visibility problem a Kafka durability failure. A Consumer that commits before its side effect completes can make a Record appear missing to the business system. A retry without idempotent producer settings can create duplicates. Log compaction can remove older values by key as designed. The verdict should describe the Record lifecycle, not the dashboard state alone.
3.5Broker disk, CPU, or network pressure is high
Resource saturation is a symptom with several possible causes. Check resource usage by Broker and Partition, input/output or request rate, and retention, replication, or cross-zone traffic indicators. Disk pressure that follows retained bytes has a different response from disk pressure caused by a replay storm or uneven Partition placement. CPU pressure during a traffic burst may be expected; CPU pressure during idle periods points toward a background task, compaction, or a noisy client. Network pressure can come from client fan-out, replica traffic, recovery, or an AZ (Availability Zone) placement decision.
Protect the cluster before balancing it. Pause low-priority replays, stop a runaway producer, or cap a known source when that action is reversible. Then check whether the emergency is procedural or architectural. If every scale event requires moving large local logs, broker storage ownership is part of the incident path. If a single retention-heavy Topic repeatedly forces volume expansion, the team should review the storage model rather than treating each alert as an isolated capacity miss.
3.6Latency or throughput oscillates without a clear traffic change
Jitter often means a queue or periodic task is entering and leaving a limit. Compare request latency percentiles, queue depth or throttling, and background activity such as compaction, segment cleanup, checkpointing, or object-storage requests. Add timestamps for deployments, leader changes, rebalances, and scheduled jobs. Averages can hide the pattern, so use the same percentile and time window across the three signals.
Do not smooth the graph before explaining the cycle. Increasing buffers may move the spike later, and adding brokers may distribute the work without removing a periodic storage or downstream limit. The useful verdict says what fills, what drains, and which action changes the cycle. That description also tells the incident commander whether to wait, shed load, or fail over.
4Restore first, root-cause later
During a live incident, a perfect explanation is less valuable than a controlled recovery. Choose the smallest action that protects the affected SLO and leaves a path back: pause a replay, roll back a client, isolate a hot producer, freeze topic automation, or shift noncritical work. Do not change several client and broker settings at once.
Use a two-track incident record:
- Recovery track: current symptom, affected scope, reversible mitigation, owner, and rollback trigger.
- Root-cause track: metric evidence, deployment timeline, Partition or Offset samples, resource path, and the condition that confirms or rejects the hypothesis.
This separation keeps the team from delaying recovery while it argues about cause. After the service is stable, ask whether the incident required local disk expansion, manual Partition movement, repeated cross-zone transfer, or excess broker headroom. Those signals belong in an architecture review.
Storage architecture changes that second review. In a traditional Kafka deployment, each Broker owns local log data and replication keeps copies aligned. A broker failure, storage alert, or scale operation can therefore create a data movement problem alongside the user-facing symptom. Tiered Storage can move older data away from local disks, but it does not by itself make brokers stateless or remove the hot write path from the Broker.
If the repeated problem is the coupling between Broker compute and durable data placement, a Shared Storage architecture becomes a relevant candidate. AutoMQ is a Kafka-compatible cloud-native streaming platform built around that model. Its S3Stream storage layer uses S3-compatible object storage for durable stream data, while a WAL (Write-Ahead Log) path and data caching serve the low-latency write and read paths. That shifts the troubleshooting map: Broker CPU and request queues remain important, while WAL health, object-storage access, cache behavior, and Catch-up Read performance become first-class signals.
The change is useful only when it matches the incident pattern. If the root cause is a slow application handler, a different storage model will not fix it. If repeated incidents are dominated by local disk pressure, replica movement, or recovery tied to Broker ownership, evaluate the Shared Storage path with your own workload. Test Kafka client behavior, normal Tailing Read, backlog Catch-up Read, Broker replacement, scale changes, object-storage failures, and rollback before changing the platform. The AutoMQ architecture overview describes the storage and Broker model in more detail.
5A one-page triage card
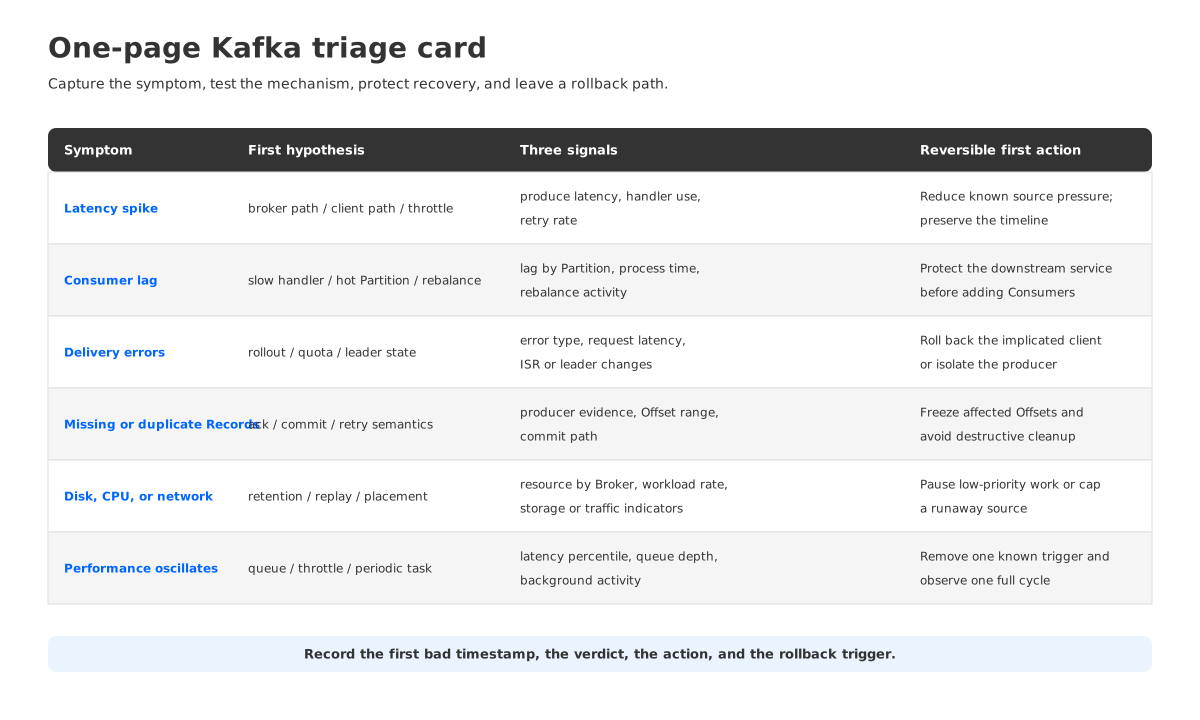
| Symptom | First hypothesis | Check these three signals | First reversible action |
|---|---|---|---|
| Latency spike | Broker path, client path, or throttling | Produce latency, handler utilization, retry rate | Reduce known source pressure and preserve the timeline |
| Consumer lag | Slow processing, hot Partition, or rebalance | Lag by Partition, processing time, rebalance activity | Protect the downstream dependency before adding Consumers |
| Delivery errors | Producer rollout, quota, network, or leader state | Error type, request latency, ISR/leader changes | Roll back the implicated client or isolate the producer |
| Missing or duplicate Records | Commit, retry, serialization, or retention semantics | Producer evidence, Offset range, commit/retry behavior | Freeze affected offsets and stop destructive cleanup |
| Disk, CPU, or network pressure | Retention, replay, placement, or replication | Resource by Broker, workload rate, storage/network indicators | Pause low-priority work or cap a runaway source |
| Oscillating performance | Queue, throttle, or periodic background task | Percentiles, queue depth, background activity | Remove one known trigger and observe one full cycle |
Add service-specific thresholds, dashboard links, owners, and rollback commands to this card. Keep the three metrics stable across incidents so trend comparisons remain meaningful.
6References
- Apache Kafka Documentation for operational concepts, configuration, and client behavior.
- Apache Kafka Consumer Configuration for consumer group and processing-related settings.
- Apache Kafka Operations for production operating concepts and cluster administration.
- Amazon MSK Troubleshooting for a cloud-provider example of symptom-based Kafka operations.
- AutoMQ Compatibility with Apache Kafka for compatibility boundaries to validate during an evaluation.
- AutoMQ S3Stream Shared Streaming Storage for the storage path and shared-storage model.
- AutoMQ WAL Storage for WAL choices and their role in the write path.
7FAQ
7.1What is the fastest way to troubleshoot Kafka?
Start with the symptom's scope and timestamp, state one plausible hypothesis, and check three metrics: the symptom, the suspected mechanism, and the recovery or blast-radius signal. This is faster than opening every component dashboard because each metric has a decision role.
7.2How do I troubleshoot Kafka consumer lag?
Compare lag by Partition, Consumer processing time, and rebalance activity. One lagging Partition suggests skew or a record-specific problem. Group-wide lag with high processing time points toward the application or downstream system. Lag that tracks rebalances points toward group membership or deployment churn.
7.3Should I add more Kafka Consumers when lag rises?
Only when the Topic has enough usable Partitions, work is distributed across them, and the downstream service can accept more concurrency. More Consumers cannot split one Partition's ordered work, and a rebalance can temporarily make recovery slower.
7.4Why can Kafka records look missing even when the cluster is healthy?
The Record may have been filtered, committed before its side effect completed, compacted by key, skipped after a deserialization failure, or never acknowledged by the producer. Trace the Record through producer acknowledgement, Topic/Partition/Offset, Consumer commit, and downstream processing before concluding that storage lost it.
7.5When does Kafka storage architecture belong in a troubleshooting review?
Bring it into the review when repeated incidents require local disk expansion, manual Partition movement, lengthy broker recovery, or unexplained replication and network pressure. A shared-storage platform can change those failure paths, but it still needs workload-specific tests for latency, catch-up reads, failure recovery, and Kafka compatibility.
When the next page arrives with the same symptom, use the card before opening the component dashboards. If the evidence repeatedly points to broker-local storage rather than a client defect, run the same workload against a Kafka-compatible shared-storage design. You can explore AutoMQ on GitHub and carry the six symptom tests into that evaluation.


