
Table of Contents
Table of Contents
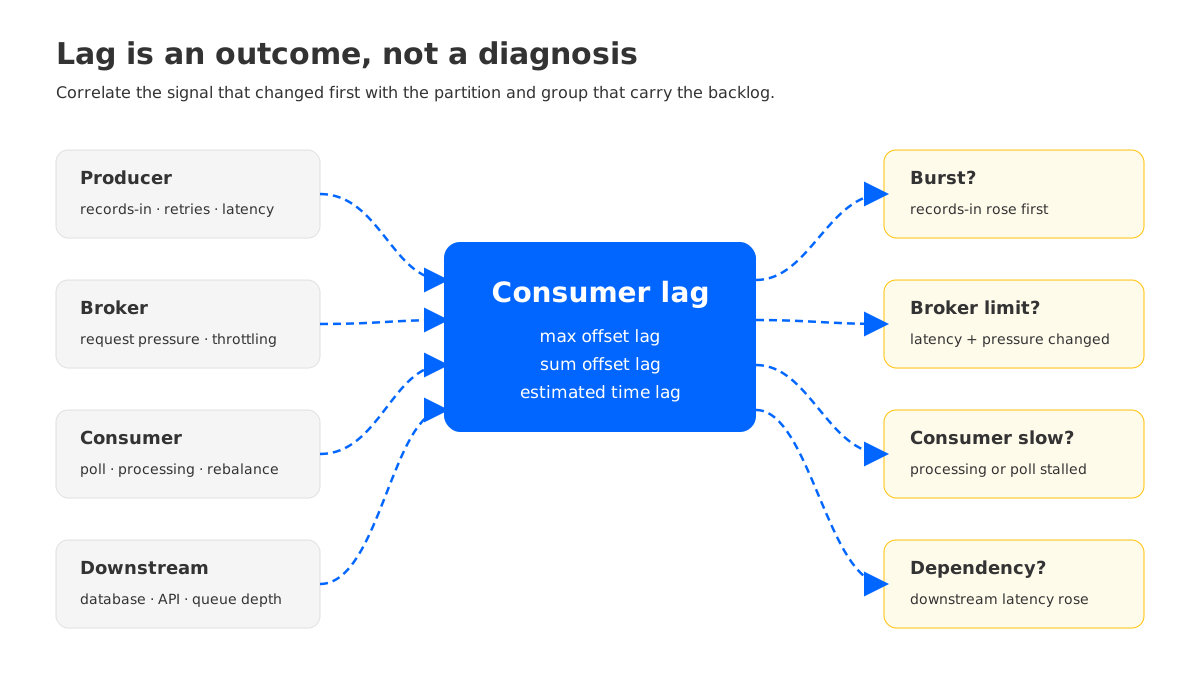
A consumer lag alert tells you that a consumer group is behind the log. It does not tell you why. The same rising lag can come from a producer burst, a broker that is throttling requests, a consumer that cannot process records fast enough, a rebalance, or a downstream database that has slowed to a crawl.
That distinction matters because the first action can make the incident worse. Adding consumer instances will not help if the topic has fewer partitions than the group has members. Increasing fetch sizes will not fix a database connection pool. Restarting every consumer during a rebalance can turn a short pause into a longer outage.
The reliable path is to treat lag as an outcome and correlate it with the signals that produced it. This guide uses Amazon MSK metrics and Apache Kafka consumer behavior to build that path, then shows where an architectural change is justified.
1Define what “lag” means before chasing it
For a partition, consumer lag is the difference between the latest offset available and the offset a consumer group has committed. A group can have low total lag while one partition is far behind, so a cluster-level average is not enough for incident response.
Use three views together:
- Maximum offset lag: the worst partition in the group. This is the most useful first signal for a “one partition is stuck” symptom.
- Sum of offset lag: the backlog across the group. It shows the amount of work waiting, but it can hide a hot partition.
- Estimated time lag: an approximation of how old the oldest unprocessed data is. It is often easier to map to a freshness SLO than a raw offset count.
Amazon MSK exposes consumer group lag metrics through CloudWatch when the relevant monitoring level is enabled. Metric availability and dimensions depend on the cluster configuration, so verify the exact set in the MSK metrics documentation before building alarms. If you export Kafka metrics through open monitoring, keep the same definitions when they reach Prometheus or another metrics system.
Lag is meaningful only relative to traffic. A group that is 100,000 records behind may catch up in a few seconds if the producer is idle; a group that is 1,000 records behind may violate a freshness objective if records arrive continuously. Record the arrival rate, processing rate, and age of the oldest pending record alongside the lag number.
2Correlate lag with the rest of the system
The fastest investigations put the lag chart beside producer, broker, consumer, and downstream charts. The shape of the curves usually narrows the search before anyone changes a setting.
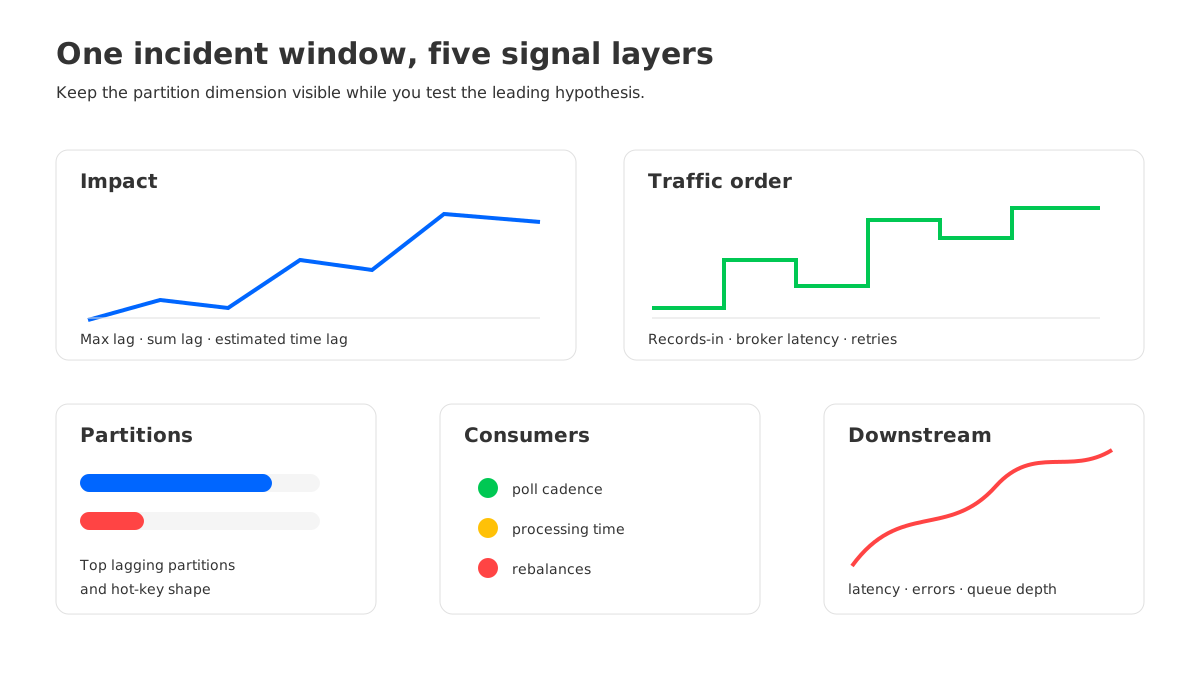
Start with a common time window and the same topic, partition, and consumer group. Then compare these signals:
| Signal layer | What to inspect | What it can explain |
|---|---|---|
| Producer | Records in per second, request latency, retries, and error rate | A traffic burst or producer retry storm |
| Broker | Bytes in/out, request latency, network or storage throttling, and under-replicated partitions | Broker capacity pressure or a replication problem |
| Consumer | Poll cadence, fetch latency, records consumed, processing time, commits, and rebalances | Slow application code, fetch starvation, or group instability |
| Downstream | Database/API latency, error rate, connection pool use, and queue depth | Backpressure outside Kafka |
| Lag | Maximum and sum offset lag plus estimated time lag | Impact and freshness, not the cause |
The key is not to collect every metric. It is to connect a symptom to a hypothesis. If lag rises at the same time as producer records-in and broker request latency, a burst or broker limit is more plausible than a consumer code regression. If lag rises while consumer processing time and downstream latency rise, the bottleneck is probably after the fetch.
A dashboard should preserve the partition dimension during an incident. A group average can look stable while a single partition is pinned to one slow key or one unhealthy consumer. Keep a panel for the top lagging partitions and a panel for the consumer members assigned to them.
3Isolate the root cause
3.1Producer burst or retry storm
A producer burst increases the rate at which offsets are created. Lag rises when consumers cannot match that rate, even if the consumers are healthy. The tell is that records-in jumps first, while consumer processing rate remains close to its previous level.
A retry storm has a different signature: producer request latency and retry counts rise, broker request queues grow, and the input rate may oscillate. Check whether a deployment changed timeouts, acknowledgments, compression, or batch settings. Inspect producer logs for repeated retries and timeouts before scaling consumers.
The mitigation is to reduce the arrival spike safely. Apply backoff at the producer, fix the failing dependency that caused retries, or temporarily route noncritical traffic to a separate topic. Do not discard records or reduce durability settings to make a lag graph look healthy. If the spike appears during a regional cutover, the replication and offset behavior described in Amazon MSK Replicator vs. MirrorMaker 2 belongs in the same incident review.
3.2Broker throttling or capacity pressure
A broker can become the limiting stage when network, request, storage, or replication work consumes its available capacity. In that case, both producers and consumers may report higher latency. Consumer lag is an effect of slower fetch service.
Look for a matching change in broker request latency, bytes in/out, throttled requests, and partition health. Confirm whether the affected partitions share a broker. A single broker pattern points toward uneven partition leadership or a hot partition; a cluster-wide pattern points toward aggregate capacity or a workload change.
The safe response is to identify the constrained resource before adding capacity. Check the MSK broker and partition guidance for the cluster type and current limits, then change one variable at a time. A capacity change can help, but it will not correct a partition-key design that sends most traffic to one partition.
3.3Consumer processing backpressure
A consumer may fetch records quickly but process them slowly. Typical causes include synchronous calls to a database or API, expensive deserialization, lock contention, garbage-collection pauses, or a bounded worker pool. Before treating authentication failures as backpressure, verify the client mechanism and broker permissions with the Amazon MSK IAM, SCRAM, and TLS authentication comparison.
Measure processing time per record or batch, poll intervals, commit time, and downstream latency. If the consumer stops polling while work is still in flight, it can also trigger a group rebalance. That creates a second symptom: lag grows during partition movement even though the original slow operation has not changed.
Fix the slow stage first. Move blocking work behind a bounded queue, batch downstream writes, increase parallelism inside the application, or isolate a slow dependency. Keep the queue bounded so a catch-up attempt does not exhaust memory. Then verify that poll cadence and commit latency return to their normal range.
3.4Rebalance or unstable membership
A rebalance pauses consumption while partitions are assigned to a changed group member set. Deployments, autoscaling, process crashes, network interruptions, and session timeouts can all cause membership churn.
Correlate the lag spike with consumer join, sync, and leave events. Check whether the same member repeatedly disappears or whether a rollout starts several consumers at once. Review the relationship between max.poll.interval.ms, session.timeout.ms, and the application's worst processing time. Raising a timeout can mask a slow consumer, so pair any setting change with a processing-time measurement.
A stable group should show a brief assignment change followed by a recovery in consumed records. If lag keeps rising after assignment stabilizes, the rebalance was a trigger rather than the root cause.
3.5Downstream latency or partial failure
When a consumer writes to a database, calls an API, or publishes to another system, that dependency becomes part of the lag path. A downstream error can cause retries that multiply work while reducing useful throughput.
Separate transient errors from sustained latency. Compare downstream request duration, error rate, queue depth, and connection usage with consumer processing time. The correct mitigation may be a circuit breaker, a retry budget, a dead-letter path for poison records, or a controlled pause on a low-priority group. Make the decision according to the freshness and delivery requirements of that workload.
4Use a hypothesis test instead of a setting hunt
During an incident, write down one sentence for the leading hypothesis and the signal that would disprove it. For example:
If a producer burst is the cause, records-in should rise before lag, and consumer processing rate should remain near its baseline.
That sentence keeps the team from changing five client settings at once. It also gives the next shift a record of what was tested.
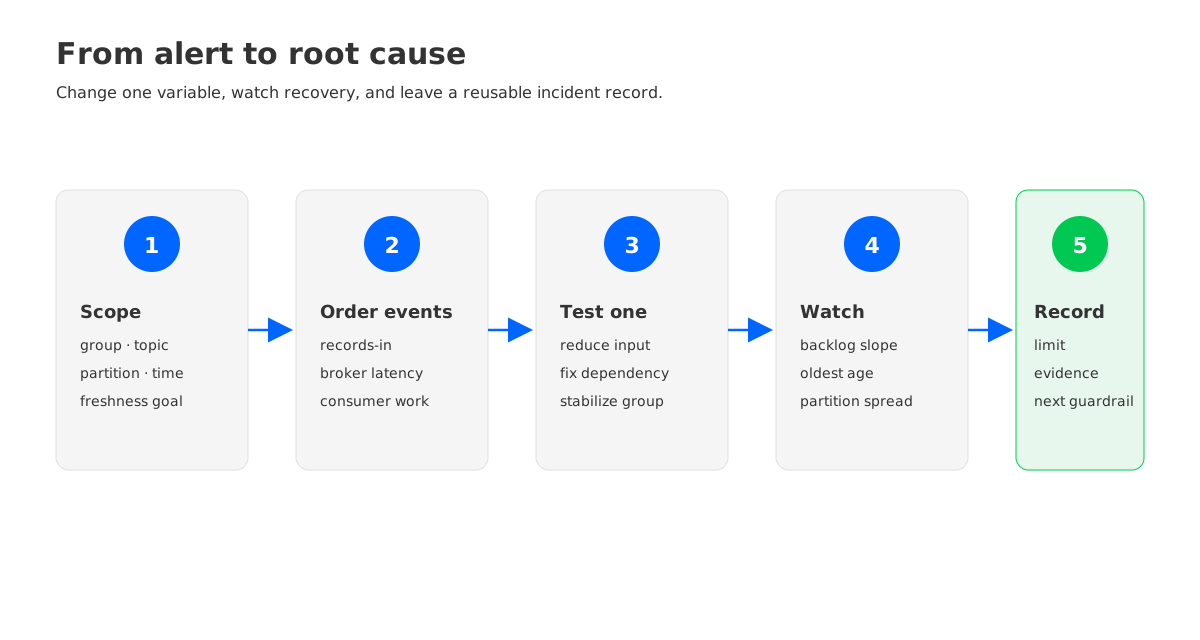
A practical sequence is:
- Scope the impact. Identify the consumer group, topic, partition, first affected timestamp, and freshness objective.
- Check the order of events. Compare records-in, broker latency, consumer processing time, rebalance events, and downstream latency.
- Choose one intervention. Reduce input, fix the slow dependency, stabilize membership, or add capacity according to the evidence.
- Watch recovery. Lag should decline at a measurable rate. If it does not, return to the hypothesis rather than stacking another change.
- Record the boundary. Note the partition count, consumer count, traffic rate, and settings that defined the limit.
Recovery rate is often more useful than the lag value itself. If the backlog is growing, the system is still losing ground. If the backlog is shrinking but estimated time lag is not, the oldest records may be concentrated in a hot partition. Track both until the freshness objective is restored.
5When the bottleneck is architectural
Client tuning works when the bottleneck is in client behavior or application work. It has diminishing returns when many consumer groups repeatedly read the same retained data and brokers are also responsible for local persistence and replication.
That is the point to review the storage and read path. Ask whether the workload has high read fan-out, replay-heavy consumers, or retention that is much larger than the active working set. If broker-local disk and network movement are the structural limit, adding consumers can increase pressure without changing the bottleneck.
A Kafka-compatible platform with a Shared Storage architecture changes that boundary by separating broker compute from durable storage. AutoMQ uses stateless brokers and object-storage-backed durability, so read scaling and broker replacement do not require each broker to own a complete local copy of retained data. That does not remove application backpressure or a hot partition; it gives teams another architecture to evaluate when storage-driven fan-out is the proven cause.
Use evidence from your own workload before making that move. Compare the percentage of read traffic that is replay or fan-out, the broker resource that saturates first, and the recovery rate after a consumer group catches up. The architecture is relevant only when those measurements point beyond a client setting.
6Prevent the next lag alert
A useful lag policy has three layers:
- Detection: alert on estimated time lag for freshness, maximum offset lag for stuck partitions, and rebalance or error signals for instability.
- Diagnosis: retain dashboards with topic, partition, group, broker, and downstream dimensions so the on-call engineer can test a hypothesis without rebuilding context.
- Capacity review: after an incident, record the traffic shape and recovery rate, then update partition, consumer, and broker headroom assumptions.
Set thresholds from the service objective and observed recovery rate. A threshold that fires on every short burst trains people to ignore alerts; one that fires only after the freshness window is already lost gives the team no room to act. Review the thresholds after traffic patterns or downstream dependencies change.
7FAQ
7.1Is consumer lag always a Kafka problem?
No. Kafka reports the backlog, while the cause may be a producer burst, broker pressure, consumer code, a rebalance, or downstream latency. Correlate the lag with the signals in the same time window.
7.2Should I add more consumers when MSK lag rises?
Only if the topic has enough partitions and the consumers are the limiting stage. If a single partition is hot, more members do not create more parallelism for that partition.
7.3Which lag metric should I alert on?
Use estimated time lag when freshness is the user-facing objective, and maximum offset lag to catch a stuck partition. Sum offset lag is useful for workload size but should not be your only alarm.
7.4When is a platform change justified?
Consider it when measurements show that broker-local storage, replication, or read fan-out is the persistent constraint after application and client causes are addressed. Validate the decision with a representative workload and a recovery test.
8References
A lag alert is a starting point, not a diagnosis. The next time the graph turns upward, identify which rate changed first, which partition is carrying the backlog, and whether the consumer is waiting on Kafka or on the system behind it. Then, if your measurements show that the storage path is the limit, run your workload through the AutoMQ pricing calculator before choosing the next capacity change.


