
Table of Contents
Table of Contents
An Amazon MSK dashboard can be full of healthy-looking charts while a customer-facing pipeline is already missing its freshness objective. Broker CPU may be normal, producer throughput may be steady, and the consumer group may still be hours behind on one partition. The problem is rarely a missing chart by itself. It is a missing relationship between signals owned by different parts of the system.
A production observability model needs to answer three questions quickly: what changed, where did it change, and what decision should follow? CloudWatch gives MSK service and broker metrics. Prometheus gives a flexible time-series path for open monitoring and application metrics. Consumer lag gives the user-facing symptom, but it is an outcome rather than a root cause. Put those signals on one timeline and an alert becomes a testable hypothesis instead of a screenshot to forward in a chat channel.
1Start with signal ownership, not dashboard layout
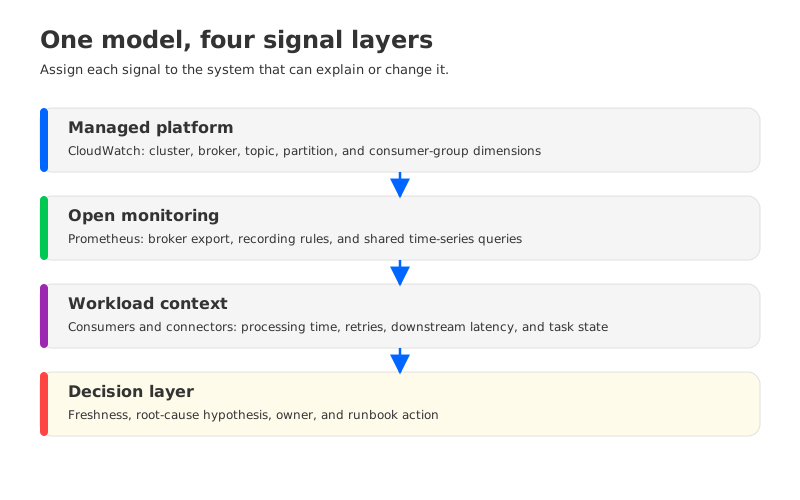
Teams often begin by copying a dashboard and then discover that nobody owns the numbers on it. A better starting point is to assign each signal to the system that can explain or change it. AWS publishes Amazon MSK metrics to CloudWatch, while MSK Provisioned clusters can expose broker metrics through Open Monitoring for Prometheus-compatible systems. Application teams own processing time and downstream latency. Platform teams own alert policy and the runbook that turns a signal into an action.
That ownership model keeps a metric from becoming an orphan. BytesInPerSec can show that traffic changed, but it cannot explain whether a consumer is meeting its freshness objective. MaxOffsetLag can show the backlog, but it cannot distinguish a producer burst from a slow database call. The first useful dashboard therefore combines signals without pretending that one system is authoritative for all of them.
| Signal layer | Useful questions | Typical owner | Primary source |
|---|---|---|---|
| Cluster and broker | Did capacity, request latency, storage, or replication pressure change? | Kafka platform / SRE | CloudWatch; Open Monitoring where enabled |
| Topic and partition | Is traffic uneven, or is one partition limiting progress? | Platform team | CloudWatch dimensions; Kafka client metrics |
| Consumer group | Is freshness degrading, and which group or partition is affected? | Application team with SRE | CloudWatch lag metrics; client telemetry |
| Connector | Is a source or sink task stalled, retrying, or producing backpressure? | Data platform team | Connector metrics and logs; Prometheus |
| Cost and usage | Did retention, traffic, or monitoring detail change the bill? | Platform / FinOps | Cost and Usage Report; workload metadata |
The table is a contract about questions, not a list of every available metric. An alert without an owner who can change the condition is only a notification.
2What CloudWatch tells you about an MSK cluster
Amazon MSK Provisioned clusters publish CloudWatch metrics at one-minute intervals. AWS groups the available metrics into monitoring levels: DEFAULT, PER_BROKER, PER_TOPIC_PER_BROKER, and PER_TOPIC_PER_PARTITION. The default level includes cluster and consumer-group signals; the higher levels add broker, topic, or partition dimensions and incur CloudWatch metric charges according to AWS pricing.
That hierarchy creates a cost and cardinality decision. Keep default metrics for fleet coverage, then enable finer dimensions when an incident pattern or service objective justifies the extra time series. Per-topic-per-partition detail can explain a hot partition that a group-level average hides, but it also creates more data to query and govern.
Consumer lag metrics are especially valuable because they connect platform behavior to application freshness. AWS documents MaxOffsetLag, SumOffsetLag, EstimatedMaxTimeLag, and rolling time-lag metrics with consumer-group and topic dimensions at the default level. A practical dashboard uses them together:
- Estimated time lag maps most directly to a freshness objective. It estimates how long the backlog would take to drain at the observed consumption rate.
- Maximum offset lag exposes a stuck or hot partition that a group average can hide.
- Sum offset lag shows the total backlog, which helps estimate recovery work but does not describe its age.
These values need traffic context. A backlog can shrink while the oldest record remains outside the freshness objective, or a large offset count can clear quickly when producers pause. Put records-in, records-out, and the age of the oldest pending work beside the lag panels so the operator can see whether the system is catching up or merely accumulating offsets more slowly.
3Where Prometheus adds context
CloudWatch is a natural source for managed-service metrics, but it is one place an MSK incident leaves evidence. AWS Open Monitoring lets an MSK Provisioned cluster expose metrics in a Prometheus-compatible format. The data can be sent to Amazon Managed Service for Prometheus through remote write or consumed by compatible tools such as Grafana and other monitoring integrations. AWS notes that Open Monitoring itself is available at no additional charge, while cross-Availability Zone data transfer can still incur charges.
Prometheus becomes most useful when it joins broker signals to application signals that MSK cannot see. A consumer can export batch processing duration, poll intervals, commit latency, retry counts, and downstream request duration. A Kafka Connect deployment can export task status, records sent, source or sink lag, and retry counters. Those measurements turn “consumer lag is high” into a narrower statement such as “lag rose after database write duration crossed the consumer’s processing budget.”
Do not treat CloudWatch and Prometheus as competing truth stores. Give each a clear role:
- Use CloudWatch for managed MSK dimensions, service health, and alarms that should survive changes in the observability stack.
- Use Prometheus for high-cardinality application and connector telemetry, recording rules, and correlation with Kubernetes or host metrics.
- Keep labels aligned across both paths: cluster, environment, topic, partition, consumer group, and connector. A dashboard that uses
cluster_namein one panel andClusterNamein another creates a manual join during the incident.
Test the export path: collector reachability to private MSK endpoints, cross-AZ placement, and visibility when scrape or remote write fails. Losing the monitoring path should be observable, not a quiet dashboard gap.
4Read lag as a correlation problem
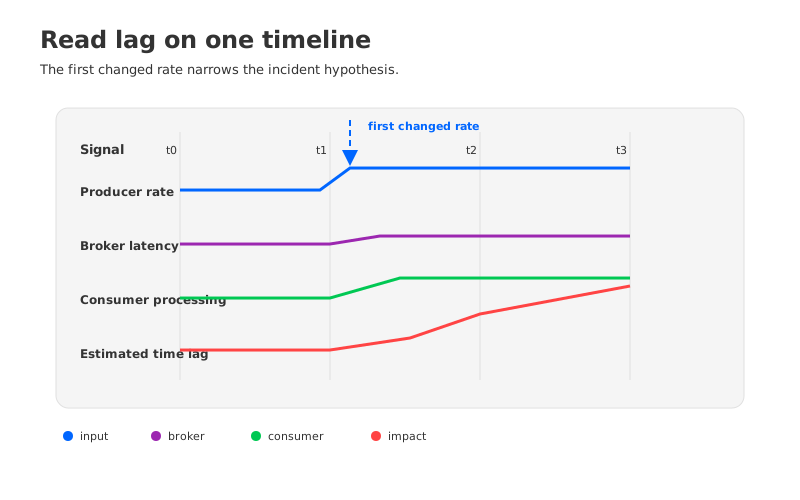
Lag is a consequence of rates. New records arrive, consumers process records, and the difference becomes backlog. The same lag curve can therefore represent very different incidents. A producer burst raises records-in before the lag curve bends upward. Consumer backpressure shows up as longer processing or downstream calls while input remains close to normal. Broker pressure tends to affect request latency and both producer and consumer service times. A rebalance creates a pause in consumption around membership changes.
The useful question is not “What is the lag threshold?” It is “Which signal changed first, and which signal should recover when the suspected cause is fixed?” Build panels with a shared time range and preserve the dimensions that matter during an incident:
- Cluster and broker request latency, bytes in and out, throttling, and partition health.
- Topic and partition records-in, records-out, and the top partitions by maximum lag.
- Consumer-group maximum and sum lag, estimated time lag, poll cadence, commits, and rebalance events.
- Connector task state, source or sink throughput, retries, and error logs.
- Downstream latency, queue depth, error rate, and connection-pool use for the systems that consumers call.
This layout clarifies ownership. If lag fires while input is steady, inspect processing and downstream panels before changing broker capacity. If input jumps first and every consumer falls behind, consider producer backpressure or a controlled capacity change. If one partition owns most of the maximum lag, adding consumers will not create parallelism for it.
5Set thresholds from service objectives
A useful alert policy starts with the consequence of delay. “Lag above 10,000” is not a service objective because the same offset count has different meanings at different arrival rates. Express the objective in terms the user recognizes: records must be visible within a freshness window, a connector must complete a batch before a cutoff, or a recovery consumer must drain a backlog before a planned handoff.
From that objective, create a small set of alert classes:
| Alert class | Signals | Operator decision |
|---|---|---|
| Freshness breach | Estimated time lag, oldest-record age, and maximum lag | Protect the user-facing deadline; identify the first changed rate |
| Stuck partition | Maximum lag by partition, records-out, and assignment | Inspect key distribution, member health, and partition ownership |
| Capacity pressure | Broker request latency, throttling, bytes in/out, and replication health | Confirm the constrained resource before scaling or rebalancing |
| Group instability | Join/sync/leave events, poll gaps, commit latency | Stabilize membership and inspect processing-time limits |
| Connector failure | Task state, retries, error rate, and source/sink throughput | Pause safely, repair the dependency, and verify replay semantics |
Use a warning level to create response time and a critical level tied to the actual objective. Evaluate persistence and recovery rate, not a single sample alone. A short producer burst should not page the same team as a lag curve that keeps growing after input returns to normal. Record the threshold rationale next to the alert definition so a future owner can change it when the workload changes.
6Design a dashboard that helps during the incident
The first screen should answer scope and urgency in less than a minute. Put the current freshness state, affected groups, and the top lagging partitions at the top. Keep a link from each panel to the runbook that names the next check and the owner. A second row can show broker and topic context; a third row can hold connector and downstream evidence. Cost and observability-pipeline health belong in a separate operational row so they inform the investigation without competing with the customer impact signal.
Avoid one giant “MSK overview” panel. It forces a reader to reconstruct the relationship between a cluster, a topic, a partition, and a consumer group. Use dashboard variables or links to move from the fleet view to a single workload while preserving the same label names. If the dashboard cannot show which dimension is missing, treat that as a design defect and fix the telemetry before the next incident.
7Turn incidents into observability feedback
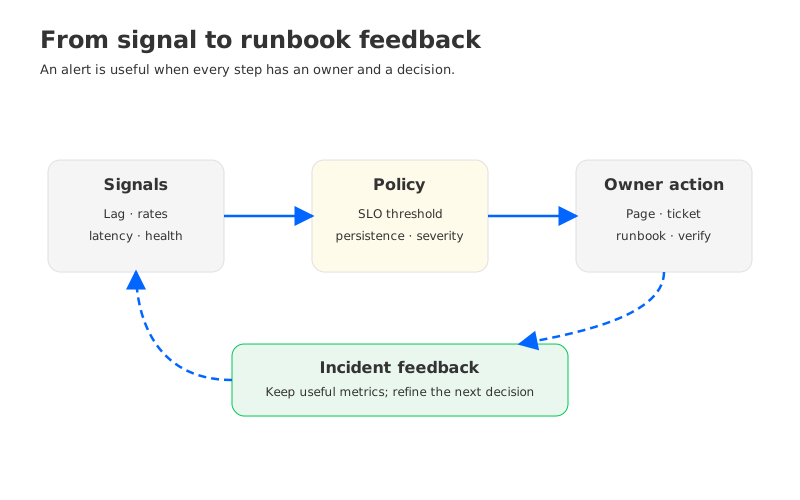
An incident review should leave the observability model stronger than it found it. Capture the first changed signal, the confirmed cause, the evidence that disproved competing hypotheses, and the time between detection and a safe intervention. Then ask whether the alert fired at the right layer. A lag page that always requires a broker investigation may need a better broker correlation panel; a broker alert that never changes the customer outcome may be noise.
This feedback loop also prevents metric sprawl. Keep a metric when it changes a decision, a runbook step, or an SLO review. Remove or downgrade panels that only provide interesting history. For high-cardinality data, record the aggregation that was useful during the incident and keep raw partition detail available for targeted drill-down rather than loading it into every default dashboard.
8When observability exposes an architecture constraint
A well-correlated dashboard can reveal a limit that tuning cannot remove. If broker-local storage, replication traffic, or replay-heavy consumer groups saturate before application processing does, adding another alert will not change the read path. The evidence should show the same resource becoming the bottleneck across workload changes and recovery tests.
At that point, evaluate the required architecture capability: Kafka API compatibility for clients, independent scaling of broker compute and durable storage, and a storage path that does not require every broker to own the full retained working set. AutoMQ is a Kafka-compatible cloud-native streaming platform with shared, object-storage-backed durability and stateless brokers. It is an option to test against the same observability model, not a reason to discard the model. Application backpressure, a hot partition, and a broken downstream database remain application problems on any platform.
Replay representative traffic with the same lag and freshness panels, then compare which resource saturates first. If the storage boundary changes, update alerts and runbooks instead of carrying over broker-local assumptions.
9FAQ
9.1Is CloudWatch enough for Amazon MSK monitoring?
CloudWatch is a strong source for managed MSK and consumer-group metrics, but application processing, connector, and downstream signals usually require client or Prometheus telemetry. The useful model correlates these sources rather than treating one system as the sole dashboard.
9.2Should every MSK cluster enable per-topic-per-partition metrics?
Use that level when partition-level diagnosis is part of the service objective or incident history. It adds dimensions and CloudWatch charges, so apply it deliberately and keep default metrics for fleet-wide coverage.
9.3What is the difference between MSK Open Monitoring and consumer lag?
Open Monitoring is a metric export path for an MSK Provisioned cluster. Consumer lag is an outcome measured for a consumer group. Open Monitoring can complement CloudWatch and application telemetry, but it does not replace a lag definition tied to freshness.
9.4How should I alert on consumer lag?
Alert on the consequence the workload cares about, such as estimated time lag or oldest-record age, and pair it with maximum lag by partition. Use traffic, processing, and recovery signals to avoid paging on a backlog that is already draining.
10References
- Amazon MSK metrics for monitoring Standard brokers with CloudWatch
- Monitor an MSK Provisioned cluster with Prometheus
- Monitor an Amazon MSK Provisioned cluster
- Prometheus metric types
- Monitoring Amazon MSK with CloudWatch alarms
- AWS MSK monitoring: cluster, broker, lag, and consumer metrics
A lag alert is only useful when it tells the on-call engineer what to check next. Start with the first changed rate, preserve the partition and group dimensions, and make every alert point to an owner and a runbook. If the resulting evidence shows that storage and replay fan-out are the structural limit, evaluate AutoMQ with your workload using the same signals you already trust.


