
Table of Contents
Table of Contents
An Apache Kafka workload can be quiet for most of the day and still overwhelm Amazon MSK during a short event. A promotion, end-of-day export, device reconnect, or database catch-up can push producers above their normal rate while consumers are still processing at their old pace. The first symptom may be producer retries, rising consumer lag, or a broker metric that looks like a capacity problem.
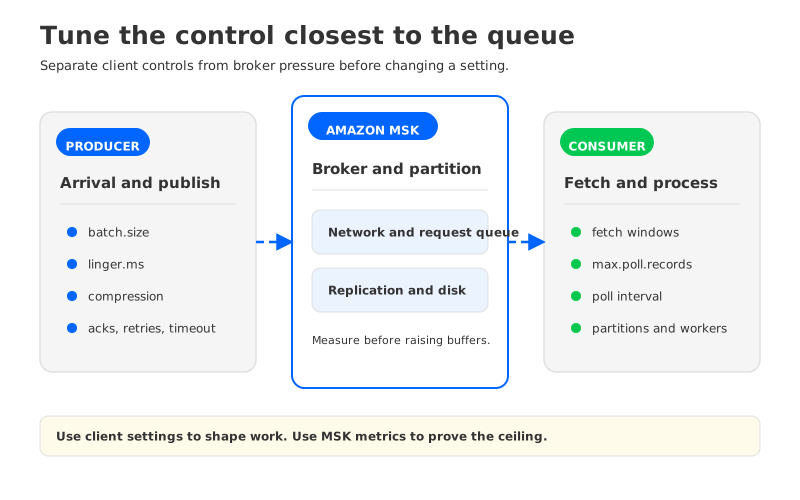
Start with a different question: which part of the burst is creating the queue? A producer can create too many small requests, a broker can spend time on replication, or a consumer can fetch quickly and then stall while processing records. Each case needs a different change. Increasing every buffer at once often makes recovery slower because more work is allowed to accumulate before the system reports pressure.
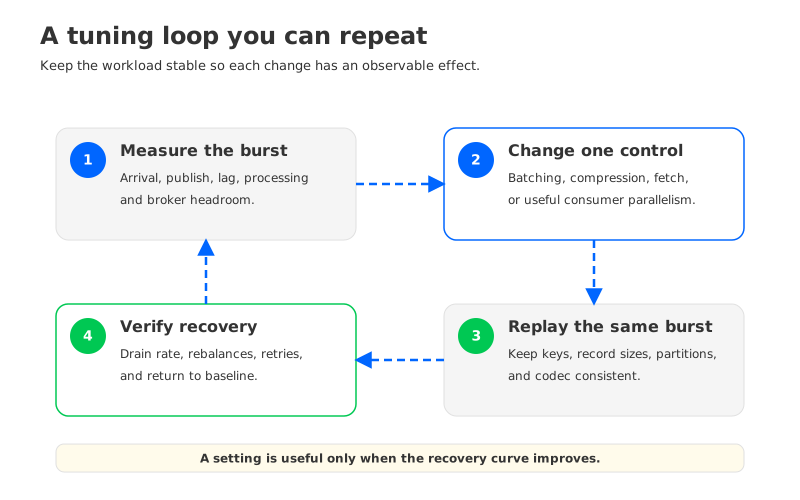
A safe tuning cycle measures the burst shape, changes one control surface, and then repeats the same workload with a recovery test. The client controls matter, but they only help when they are matched to partition count, broker headroom, network locality, and the amount of work a consumer can finish per poll.
1Start with the shape of the burst
Before changing a property, separate four rates that are often collapsed into one dashboard line:
- Arrival rate: records and bytes entering the producer application.
- Publish rate: records acknowledged by Kafka, including retries.
- Replication work: bytes written to broker logs and replicated to followers.
- Processing rate: records that consumers fetch, process, and commit.
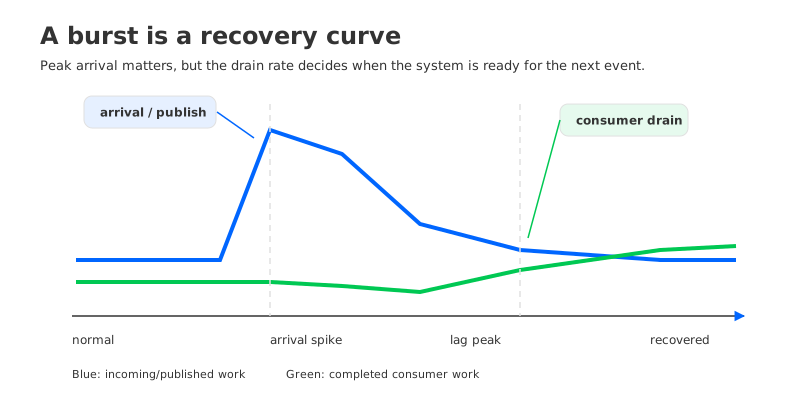
A burst has at least two dimensions: its peak and its duration. A short peak that fits in producer memory is a buffering problem. A sustained rate above consumer processing capacity is a backlog problem. A burst that includes retries can be both, because failed requests add work while the application continues sending new records.
Use the same time window for client metrics and MSK metrics. At minimum, capture producer request latency, record retries, batch size, compression rate, and outgoing bytes. On the consumer side, capture records consumed, fetch latency, poll interval, processing time, commit latency, and lag by partition. At the cluster level, correlate those observations with the Amazon MSK metrics reference, especially broker network, disk, CPU, and request metrics.
A useful first diagnosis looks like this:
| Observation during the burst | Likely pressure point | First check |
|---|---|---|
| Producer request rate rises faster than record rate | Small or fragmented batches | Batch size, linger, compression, and partition key distribution |
| Requests time out while broker utilization is moderate | Client connection or network path | Connections per broker, DNS, security groups, and retry timing |
| Produce succeeds, but lag grows on a few partitions | Hot keys or uneven partition load | Key distribution and per-partition throughput |
| Lag grows across every partition | Consumer processing or total capacity | Processing time, poll cadence, and consumer parallelism |
| Lag falls slowly after arrival returns to normal | Recovery rate is too close to arrival rate | Consumer headroom and fetch/processing overlap |
The table is a starting hypothesis, not a replacement for measurement. A single average hides the difference between one hot partition and a cluster-wide shortage.
2Tune producers for fewer, useful requests
Kafka producers already buffer records. The goal is to let that buffer form requests that fit the workload without turning a brief burst into an unbounded memory queue.
batch.size controls how much data a producer tries to place in one batch per partition. A larger batch can reduce request overhead and improve compression, but it does not force the producer to wait for a full batch. linger.ms adds a bounded wait so records that arrive close together can share a request. The right relationship depends on your latency budget: a larger wait can help a bursty workload, while an interactive workload may need a smaller window.
Test these two settings together. Changing only batch.size often does little when records arrive slowly; changing only linger.ms can add latency without creating useful batches. Watch the measured batch size and request rate, rather than the configured values alone. If the average batch remains small, inspect partitioning and producer concurrency before increasing the buffer again.
Compression changes the trade-off between client CPU and network and broker write volume. The Apache Kafka producer configuration reference documents the supported codecs and producer controls. Pick a codec that your client runtime handles consistently, then measure end-to-end effects under the burst: CPU on the producer, compressed bytes on the wire, broker request latency, and consumer decompression cost. A codec that reduces network traffic but saturates producer CPU can move the bottleneck rather than remove it.
Acknowledgments and in-flight requests define the failure behavior as much as the throughput behavior. acks=all asks the leader to wait for the in-sync replicas required by the topic configuration. It can increase acknowledgment latency during replication pressure, but it gives the application a clearer durability contract than treating an accepted socket write as success. max.in.flight.requests.per.connection also matters when retries are enabled. Keep ordering requirements explicit, and test the combination under a broker restart or a throttled network path.
Retries need a time budget. delivery.timeout.ms bounds how long the producer can keep trying a record, while backoff settings shape the retry pattern. A retry policy that is too aggressive can create a request storm exactly when brokers are recovering. A policy that is too short can surface avoidable failures to the application. Record the timeout, retry count, and final error together so an incident review can distinguish an overloaded broker from an application deadline.
Partitioning is the producer control that client tuning cannot repair. If one key maps most records to one partition, increasing producer threads or batch sizes will make that partition hotter. Inspect records per partition during the event and verify that the key is preserving the business ordering you need. When ordering is local to an entity, choose a key that spreads entities across partitions while keeping each entity’s sequence intact.
3Give the broker a measurable ceiling
Client settings cannot turn a partition or broker into infinite capacity. Amazon MSK quotas and broker instance limits are account- and configuration-specific, so use the current MSK service limits and your cluster metrics as the boundary for a test. Do not copy a value from a different instance family or treat a third-party tuning table as a service guarantee.
The producer test should answer three questions:
- Does request batching reduce per-record overhead without breaching the latency objective?
- Does the cluster retain headroom while the burst is active?
- After the input returns to normal, does the system drain the queue at a rate that leaves room for the next event?
Headroom includes more than CPU. Track broker network, disk utilization, request queue time, replication health, and the number of under-replicated partitions. A producer configuration that looks efficient in a single-broker test may create a replication queue when the same bytes are written to a multi-AZ (Availability Zone) cluster.
Avoid using retries as a capacity test. Run a controlled load that starts below the observed ceiling, steps up in measured increments, and stops before the application enters an uncontrolled retry loop. Keep the message size distribution, key distribution, compression codec, acknowledgment mode, and partition count fixed between runs. The result is useful only when the run can be repeated.
4Tune consumers around processing, not fetch size alone
Consumer lag is the distance between the log end and the group’s committed position. Fetch settings influence how quickly a consumer can receive data, but the application’s processing loop determines how quickly the committed position advances.
fetch.min.bytes and fetch.max.wait.ms can trade request frequency for fuller fetches. Larger fetches may help a consumer that can process batches efficiently. They can hurt an application that holds records in memory or has a strict per-message latency target. max.partition.fetch.bytes caps the data returned for a partition in one fetch, while fetch.max.bytes caps a fetch across partitions. Set these with the largest expected record and the application’s memory budget in mind.
The consumer must also call poll() often enough to remain a member of its group. max.poll.records limits how many records are returned to the application per poll. If processing a batch takes longer than max.poll.interval.ms, the group can treat the consumer as unresponsive and rebalance. That rebalance pauses useful work and may create a second lag spike. Measure processing time per poll, including database calls, HTTP requests, serialization, and commit work, then set the poll interval from observed tail latency rather than from the average.
Parallelism comes from partitions. A consumer group can use multiple members, but one partition is assigned to one member at a time. Adding consumers beyond the partition count does not increase read parallelism. Before adding brokers or consumers, check whether the lag is concentrated in a small number of partitions, whether the group is rebalancing, and whether downstream work is serialized behind a shared lock.
The recovery target is a rate calculation:
Drain rate = processing rate − arrival rate while the burst is being cleared.
If that difference is close to zero, the group may be healthy during normal traffic and still never recover after a burst. Increase useful parallelism, reduce per-record processing cost, or change the partition layout. Increasing fetch buffers alone only moves more data into the consumer process.
5Treat recovery as part of tuning
A tuning run is incomplete until it includes the return to normal traffic. Stop the producer burst and watch lag, consumer processing time, rebalance events, and broker request latency until the group reaches its normal baseline. If lag falls in a smooth curve, the consumer has spare capacity. If it falls in steps, look for batch commit boundaries, downstream rate limits, or group rebalances.
Failure tests should be small and deliberate. Pause one consumer, restart a producer connection, or introduce a controlled broker-side throttle in a non-production environment. Check whether retries preserve the intended ordering, whether the consumer group resumes from committed offsets, and whether alerting fires before the backlog threatens the recovery objective.
Do not hide a slow downstream dependency by raising max.poll.interval.ms indefinitely. That can reduce rebalance frequency while allowing a stuck worker to hold partitions for longer. Give the processing path its own timeout and expose the slow dependency in the lag dashboard. A consumer that is technically “alive” but cannot commit progress is still part of the incident.
The same principle applies to autoscaling. Scale on a signal tied to work, such as lag per partition and processing time, rather than on CPU alone. CPU can remain low while a consumer waits on a database, or it can be high while the consumer is successfully draining the queue. Keep a cooldown long enough to observe a full fetch-and-process cycle, then verify that the added member actually receives partitions.
6When client tuning exposes an architecture limit
A well-tuned client still depends on the storage and compute shape of the Kafka platform. If every burst requires adding broker capacity to obtain temporary storage headroom, the team is coupling two decisions: how much compute producers and consumers need, and how much durable data the brokers must retain. That coupling becomes more visible when retention is long, fan-out is high, or a recovery test requires replaying a large window.
At that point, compare the required architecture capabilities rather than adding another client property. Shared Storage architecture, stateless brokers, independent compute scaling, and Kafka protocol compatibility address a different constraint from batching or fetch windows. AutoMQ is a Kafka-compatible cloud-native streaming platform that separates the storage layer from broker compute and uses object storage as the durable foundation; the architecture overview describes that storage model. That does not remove the need to tune clients, but it can change whether a short burst forces a storage-sized broker fleet.
The decision boundary is practical: if the producer and consumer controls are within their latency and recovery targets, keep the current MSK architecture and document the tested envelope. If the controls are reasonable but storage, broker movement, or recovery windows remain the limiting factors, run the same workload against a Shared Storage architecture for Kafka and compare the evidence.
7FAQ
7.1What is the first Amazon MSK producer setting to change for bursty traffic?
Measure batch size and request rate first. Test batch.size and linger.ms as a pair, then verify producer latency and broker headroom. A larger buffer is not a fix for a hot partition or a broker that is already constrained by replication.
7.2Should I increase consumer fetch sizes to clear MSK lag?
Only when the consumer can process larger batches within its memory and poll interval budgets. Check processing time per poll, max.poll.records, max.partition.fetch.bytes, and downstream latency together. If one partition owns most of the lag, fetch size will not create parallelism.
7.3Does compression always improve burst performance?
No. Compression can reduce network and broker write bytes while increasing producer or consumer CPU. Compare the full path under the same record distribution and codec settings before making it a default.
7.4How do I know whether the problem is MSK capacity or a client setting?
Correlate client request and processing metrics with broker network, disk, CPU, request latency, replication health, and per-partition lag. A client-side queue with healthy broker metrics points to batching, partitioning, or processing. Broker pressure across partitions points to capacity or workload shape.
8References
- Apache Kafka producer configuration
- Apache Kafka consumer configuration
- Amazon MSK metrics
- Amazon MSK service limits
- Amazon MSK best practices
A burst should leave you with a measurable recovery curve, not a larger collection of untested client properties. Capture the shape of the next event, run the same producer and consumer controls against it, and compare the drain rate with the recovery objective. If you want to test whether storage and broker compute are the real constraint, start an AutoMQ evaluation with the same partitions, records, retention, and failure checks.


