
Table of Contents
Table of Contents
An Apache Kafka cluster can be available while a business pipeline is already failing its promise. Producers may still receive successful acknowledgments, yet a fraud detector is reading stale events. Brokers may report normal CPU, while one consumer group is falling behind because its database sink is retrying. An Amazon MSK SLO has to describe the service a customer experiences, not just the health of the infrastructure underneath it.
That distinction changes the work. Instead of asking whether MSK is “up,” a platform team defines measurable outcomes for publish success, end-to-end freshness, consumer progress, recovery, and the cost of preserving those outcomes. Each objective needs a measurement boundary, a target, and an owner. The resulting error budget becomes a decision tool for releases and capacity changes, rather than a percentage copied from a vendor dashboard.
1Start with service level objectives, not vendor metrics
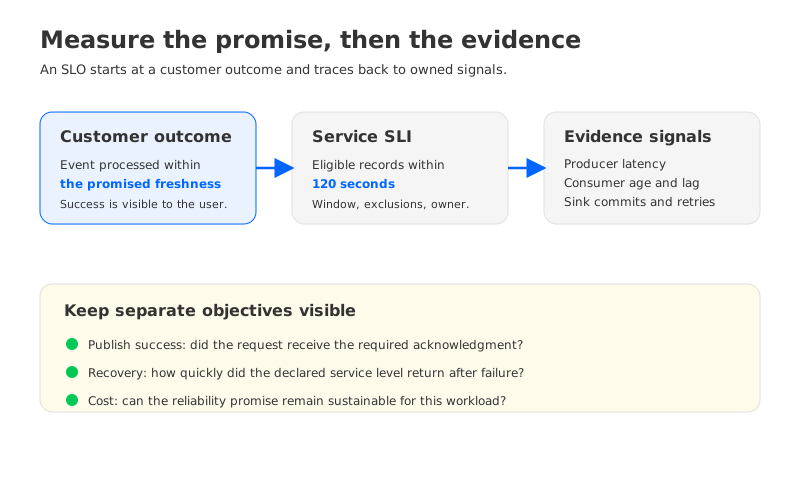
An SLO is a target for a service level indicator, or SLI, measured over a stated time window. For an MSK-backed event pipeline, the SLI is often a ratio or latency distribution built from producer, broker, consumer, and application telemetry. A CloudWatch metric can be one input, but it is rarely the complete SLI. AWS documents cluster, broker, and topic metrics for Amazon MSK monitoring, while the customer-facing question may be “How many checkout events reached the inventory service within two minutes?”
A useful first set of objectives separates the promises that operators otherwise mix together:
- Publish success: the percentage of eligible produce requests that receive the required acknowledgment without an error or timeout.
- Publish latency: the percentile latency for successful produce requests, measured at the client boundary and segmented by topic or workload class.
- Freshness: the percentage of events consumed within a defined age, such as the time from record creation to successful processing.
- Consumer progress: the proportion of time a consumer group stays below a lag threshold that has business meaning for that workload.
- Recovery: the time required to restore the declared service level after a broker, dependency, or region failure, measured from the agreed incident start.
- Cost guardrail: a limit on spend or cost per processed event that keeps the reliability promise economically sustainable.
These objectives answer different questions. A publish SLO can pass while freshness fails because the sink is slow. A consumer lag SLO can pass while recovery time fails after a networking incident. Keeping them separate prevents one healthy chart from masking another broken promise.
1.1Choose targets that expose a decision
Targets should be strict enough to change behavior and loose enough to leave room for planned work. A target of 99.9% successful publishes over a 30-day window leaves roughly 43 minutes and 12 seconds of failed-request budget when the window is treated as 43,200 minutes. That arithmetic is not an MSK guarantee; it follows of the target and the chosen window. If the business cannot tolerate that exposure, the target or the measurement window needs to change.
Latency and freshness should be expressed as distributions or time compliance, not averages. “Average publish latency under 50 ms” can hide a small set of requests that time out during a rebalance. “99% of eligible records processed within 120 seconds” makes the user impact explicit and can be joined to application events. The number 120 seconds is an example policy value, not a universal Kafka threshold. Select it from the downstream contract, replay tolerance, and incident history.
2Define the measurement boundary before building the dashboard
Most SLO disputes are boundary disputes. One team counts a record when the producer receives an acknowledgment; another counts it when the warehouse commits a transaction. Both measurements can be correct, but they describe different services. Write the start event, end event, exclusions, and sampling rules before writing an alert.
For a publish SLI, the start might be a client send timestamp and the end a successful acknowledgment at the required Kafka acknowledgment level. For freshness, the start should be the event creation timestamp carried in the record or envelope, and the end should be the downstream success signal. Consumer lag, represented by offset distance, is a useful leading indicator, but it is not a substitute for elapsed event age when producers are bursty or partitions have uneven traffic.
An operational boundary usually needs these fields:
| Field | Example decision | Why it matters |
|---|---|---|
| Eligible traffic | Production topics carrying checkout events | Excludes test and replay traffic from the customer SLO |
| Start event | Producer send or event creation timestamp | Defines when the clock begins |
| Success event | Required acknowledgment or sink commit | Defines what “served” means |
| Exclusions | Deliberate backfills, maintenance windows approved in advance | Prevents planned work from silently consuming budget |
| Aggregation | Per topic, consumer group, region, and workload class | Keeps a healthy high-volume stream from hiding a small critical one |
The boundary also determines which system owns the evidence. AWS MSK metrics details can support broker and cluster context. Kafka client metrics and application traces are needed for request latency, event age, and sink completion. The SLO record should link those sources so an on-call engineer can move from a breach to a diagnosis without guessing which dashboard is authoritative.
3Turn the error budget into an operating policy
The error budget is the allowed amount of bad service within the SLO window. If the availability target is 99.9%, the budget is 0.1% of eligible requests. For a freshness target of 99% within two minutes, the budget is 1% of eligible records outside that age. A budget is useful only when the team has agreed what happens as it burns.
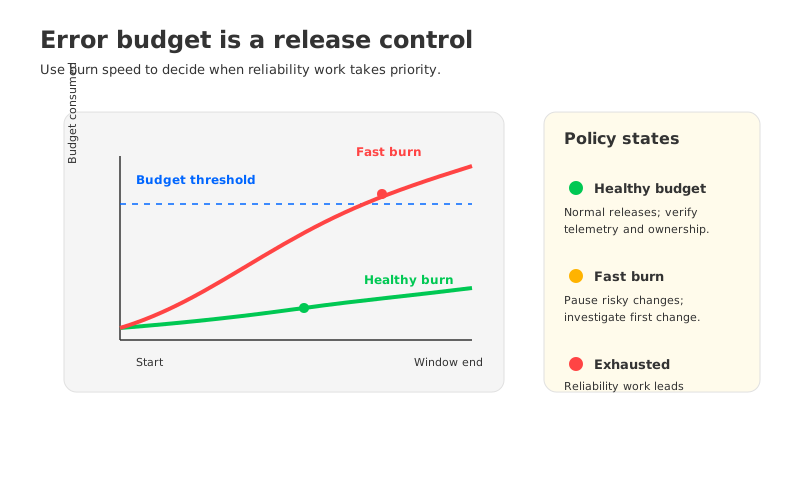
A practical policy separates three states:
- Healthy budget: normal releases and capacity work continue, while the team watches the burn rate and verifies that the measurement pipeline is working.
- Fast burn: a short window shows a breach rate that would spend the monthly budget quickly. Pause risky changes, assign an incident owner, and investigate the first changed signal.
- Budget exhausted: reliability work takes priority over feature rollout until the team has a written recovery plan and evidence that the SLI has returned to target.
The policy should name exceptions. A security patch may proceed during a budget freeze, but the exception owner and rollback plan belong in the change record. A replay may be excluded from freshness only if it is labeled before ingestion and does not quietly affect the customer path. Without these rules, “error budget policy” becomes a dashboard annotation instead of a control on engineering decisions.
3.1Alert on burn, then use symptoms to find the cause
A single threshold on MaxOffsetLag is easy to create and easy to misread. A lag value that is acceptable for a batch consumer may be an outage for a payment authorization path. Burn-rate alerts are more portable because they ask how quickly the declared budget is being consumed, while symptom alerts provide the evidence needed to debug.
Pair the two layers:
- SLO burn alert: the SLI is consuming its budget faster than the policy allows across a short and a long window.
- User-impact alert: freshness, publish failures, or processing latency crosses the service-specific threshold.
- Diagnostic alert: broker request latency, under-replicated partitions, throttling, consumer rebalances, or sink retries point toward a cause.
This design avoids paging on every diagnostic fluctuation. It also avoids waiting for lag to become enormous before the team learns that a downstream dependency has slowed. The exact burn windows depend on the SLO window and paging policy; document the formula and test it with replayed incident data before relying on it in production.
4Use SLO breaches to make capacity decisions
A breach should change a decision, not end with a postmortem. If publish latency burns budget while broker request latency and network utilization rise together, the next action may be partition placement or broker capacity. If the brokers remain healthy but freshness burns budget during sink retries, adding brokers will not solve the problem. If recovery objectives fail repeatedly because restoring data takes too long, retention, replication, and recovery procedures deserve review before another instance-size change. For a related capacity decision, see why adding brokers does not always fix a Kafka bottleneck. Teams evaluating the managed service boundary can also compare the operational questions in MSK Express explained.
The same model also helps compare architectures. AutoMQ is a Kafka-compatible cloud-native streaming system with a shared-storage data plane. It can be evaluated using the same publish, freshness, recovery, and cost SLOs as an MSK deployment. The comparison is meaningful only when the workload, measurement boundary, and target remain constant. A lower broker metric is not evidence of a better customer SLO, and a different storage model does not remove the need to measure end-to-end behavior.
That common frame is useful for teams considering a BYOC deployment or a migration path. It lets them ask whether stateless brokers, object-storage-backed durability, or independent scaling changes a specific SLO bottleneck. It also keeps the decision honest: if the failing objective belongs to a connector or downstream database, changing the streaming layer may not improve it.
5A review checklist for platform teams
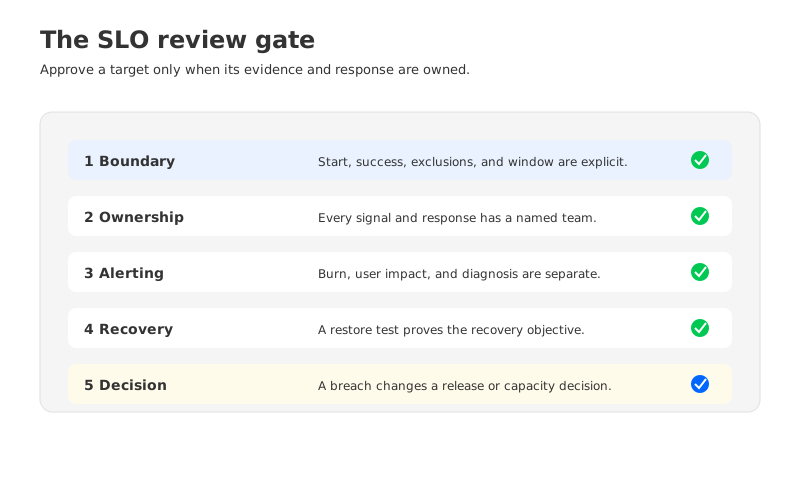
Before publishing an SLO or changing a production target, review it with the teams that own the path:
- Can an engineer reproduce the SLI from retained telemetry and identify every exclusion?
- Does the target describe a customer or business outcome rather than a single broker metric?
- Are topics, consumer groups, regions, and workload classes segmented where their tolerance differs?
- Does the error-budget policy name release, incident, and exception actions?
- Do alerts distinguish budget burn, user impact, and diagnostic evidence?
- Can a capacity or architecture change be tied to a measured SLO failure?
- Has the team tested recovery against the declared recovery objective?
5.1FAQ
5.1.1Is Amazon MSK availability itself an SLO?
It can be an infrastructure SLI, but it is rarely a complete customer SLO. Pair it with publish success, freshness, or consumer progress so a healthy cluster does not hide a broken pipeline.
5.1.2Should consumer lag be the primary SLO?
Use lag when offset distance maps closely to user impact. For bursty producers or variable processing time, event age and sink completion usually describe freshness more directly. Lag remains valuable as diagnostic evidence.
5.1.3What should the error-budget window be?
Use a window that matches the decision cadence. A 30-day window supports release governance, while shorter windows help detect fast burns. State the window explicitly and keep it consistent when comparing services.
5.1.4Can AutoMQ and Amazon MSK be compared with the same SLOs?
Yes, if the service boundary, workload, target, and exclusions are held constant. Compare customer outcomes and recovery evidence, not isolated vendor metrics.
The useful question is not whether an MSK dashboard is green. It is whether the event reached the person or system that needed it within the promised time, and whether the remaining error budget supports the next change. Write that promise down, connect it to evidence, and use the budget to decide what the team does next. If you are evaluating a Kafka-compatible architecture against the same SLOs, start an AutoMQ evaluation with your own workload and measurement boundary.


