
Introduction
In today's highly competitive market environment, data analysis has become crucial for enterprises to achieve differentiation and precision marketing. By analyzing user behavior data, businesses can gain deep insights into users' habits, preferences, and behavioral patterns, enabling them to more accurately target their market, develop personalized marketing strategies, and offer customized recommendations and services.
In stream processing and data analysis scenarios, [Kafka][1], as a high-throughput, low-latency distributed messaging system, has become core infrastructure in this field. Meanwhile, [AutoMQ][2] has redesigned Kafka based on the cloud, utilizing object storage. While maintaining 100% compatibility with Apache Kafka, AutoMQ offers users up to 10 times the cost advantage and a hundredfold elasticity. Similarly, [Tinybird][3] is a powerful real-time data analytics platform that can ingest batch and streaming data, supporting SQL queries through API to help users quickly build efficient data products.
This article will delve into how to integrate AutoMQ and Tinybird by analyzing user order information to optimize the statistical analysis process of user orders. Leveraging these two tools, we can achieve real-time user data collection, efficient data processing, and intuitive data visualization. This provides a more comprehensive and accurate understanding of user purchasing habits and preferences, offering strong support for precision marketing. By reading this article, you will learn how to seamlessly import website log information into Tinybird and use Tinybird for user behavior data analysis and visualization.
Prerequisites
-
Available Tinybird environment: Ensure you have a working Tinybird environment. If you do not have one, refer to its [official documentation][4] for more information.
-
AutoMQ with a public IP: You need an AutoMQ instance with a public IP and started with the SASL_SSL protocol. Since Tinybird is built based on a SaaS model, it can only connect to AutoMQ via the network. For user information security considerations, Tinybird requires the AutoMQ to be started using the SASL_SSL security protocol to ensure the security and reliability of data transmission. SASL is used for authentication between the client and server, while SSL ensures encryption and protection of data during transmission.
Step 1: Launch AutoMQ Using the SASL_SSL Protocol
When launching AutoMQ and ensuring it uses the SASL_SSL protocol, you should have the following prerequisite knowledge:
-
[Deploying AutoMQ in Cluster Mode on a Linux Host | AutoMQ][5]
-
AutoMQ SASL Security Authentication Configuration Guide[6]
-
AutoMQ SSL Security Protocol Configuration Guide[7]
After understanding the above content, this article will briefly introduce the key configuration files required to start a usable AutoMQ environment, helping you complete the configuration smoothly. During the operation, please replace the relevant file paths with the paths where your actual resources are located.
Configuration of Brokers
Configuring SASL
listeners=BROKER_SASL://:9092,CONTROLLER_SASL://:9093
inter.broker.listener.name=BROKER_SASL
sasl.enabled.mechanisms=PLAIN
sasl.mechanism.inter.broker.protocol=PLAIN
sasl.mechanism.controller.protocol=PLAIN
listener.name.broker_sasl.plain.connections.max.reauth.ms=10000
controller.listener.names=CONTROLLER_SASL

listener.name.broker_sasl.plain.sasl.jaas.config=org.apache.kafka.common.security.plain.PlainLoginModule required \
   username="_automq" \
   password="automq-secret" \
   user__automq="automq-secret";
listener.name.controller_sasl.plain.sasl.jaas.config=org.apache.kafka.common.security.plain.PlainLoginModule required \
   username="_automq" \
   password="automq-secret" \
   user__automq="automq-secret";
The above configuration indicates that we named two listeners: BROKER_SASL and CONTROLLER_SASL, and set the allowed security mechanism to PLAIN. Additionally, we created the same user "_automq" with the password "automq-secret" for both listeners.
Configuring SASL_SSL
listener.security.protocol.map=CONTROLLER:PLAINTEXT,PLAINTEXT:PLAINTEXT,SSL:SSL,SASL_PLAINTEXT:SASL_PLAINTEXT,SASL_SSL:SASL_SSL,BROKER_SASL:SASL_SSL,EXTERNAL:PLAINTEXT,CONTROLLER_SASL:SASL_SSLBy configuring `listener.security.protocol.map`, we mapped the two listener names to the security protocol SASL_SSL.
SSL Configuration
# Enable the following setting to verify the client
# ssl.client.auth=required
ssl.keystore.location=/root/automq/ssl/automq.space.jks
ssl.keystore.password=mhrx2d7h
# The private key can be provided in an unencrypted form, in which case no password is needed
ssl.key.password=mhrx2d7h
# Set the following parameter to disable hostname verification
ssl.endpoint.identification.algorithm=
In the above configuration file, we specified the required keystore and disabled hostname verification. The keystore is specified as the JKS file downloaded from the cloud providers.
Client Configuration
The dataset for the example in this article can be freely downloaded from the [Kaggle][8] website. The order information needs to be sent to the Broker's Topic via the Client.
Configure Cloud Provider's Root Certificate for the Client
-
Download the root certificate from the cloud provider.
-
Add the root certificate to the client's truststore.
Add the root certificate into the truststore using the following command:
keytool -import -file /root/automq/ssl/DigicertG2ROOT.cer -keystore client.truststore.jks -alias root-certificateSpecific configuration in client.properties
sasl.jaas.config=org.apache.kafka.common.security.plain.PlainLoginModule required username="_automq" password="automq-secret";
security.protocol=SASL_SSL
ssl.truststore.location=/root/automq/ssl/client.truststore.jks
ssl.truststore.password=123456
# You can actually use the certificate as the truststore directly, as shown below
# ssl.truststore.location=/root/automq/ssl/automq.space.jks
# ssl.truststore.password=xxxxx
sasl.mechanism=PLAIN
# When disabling hostname verification, the client must also set the following parameter
ssl.endpoint.identification.algorithm=
Provide the client with the necessary account and password for the connection, as well as the corresponding security mechanism. Also, supply the client's trust store to verify the certificate when the server sends it over.
Configuration file to start AutoMQ
bin/kafka-server-start.sh /root/automq/config/kraft/sasl_ssl.propertiesStep Two: Prepare data for AutoMQ
Now we have some order data. The information includes user order ID, order creation time, product name, product barcode, product category, delivery address, purchase quantity, product unit price, product cost price, revenue, and profit per order. The data format is as follows:
{
    "order_id": "141234",
    "order_date": "2019/1/22 21:25:00",
    "product", "iPhone",
    "product_ean": "5563319511488",
    "categorie": "Vêtements",
    "purchase_address": "944 Walnut St, Boston, MA 02215",
    "quantity_ordered": "1",
    "price_each": "700",
    "cost_price": "231",
    "turnover": "700",
    "margin": "469"
}
First, we need to create a Topic in the AutoMQ cluster:
bin/kafka-topics.sh --bootstrap-server xxx.xxx.200.218:9092 --command-config /root/automq/bin/client.properties --create --topic automq-shop1Then we need to simulate the website data stream flowing into the Topic of an AutoMQ cluster through a script. The implementation of the `data.sh` script is as follows:
#!/bin/bash

BOOTSTRAP_SERVERS="47.252.41.105:9092"
TOPIC="automq-shop"
CSV_FILE="orders.csv"
messages=""
MAX_LINES=1000
line_count=0

while IFS=',' read -r order_date order_id product product_ean categorie purchase_address1 purchase_address2 purchase_address3 quantity_ordered price_each cost_price turnover margin; do

    if [[ "$order_date" == "Order Date" ]]; then
        continue
    fi

    ((line_count++))

    if [[ $line_count -gt $MAX_LINES ]]; then
        break
    fi

    purchase_address="${purchase_address1},${purchase_address2},${purchase_address3}"
    purchase_address=$(echo $purchase_address | tr -d '"')

    order_json="{\"order_date\":\"$order_date\",\"order_id\":\"$order_id\",\"product\":\"$product\",\"product_ean\":\"$product_ean\",\"categorie\":\"$categorie\",\"purchase_address\":\"$purchase_address\",\"quantity_ordered\":\"$quantity_ordered\",\"price_each\":\"$price_each\",\"cost_price\":\"$cost_price\",\"turnover\":\"$turnover\",\"margin\":\"$margin\"}"

    if [ -z "$messages" ]; then
        messages="${order_json}"
    else
        messages="${messages}#${order_json}"
    fi

done < "$CSV_FILE"

echo "$messages" | tr '#' '\n' | /Users/wzj/Desktop/app/automq/bin/kafka-console-producer.sh --broker-list "$BOOTSTRAP_SERVERS" --topic "$TOPIC" --producer.config client.properties
Create the above script and run it, so we can get the data ready.
Step 3: Import Data Stream into Tinybird
Tinybird supports data import not only from Kafka but also from sources such as Confluent, Amazon S3, BigQuery, and more. Below we will show you how to import data from AutoMQ into Tinybird.
Create Data Source
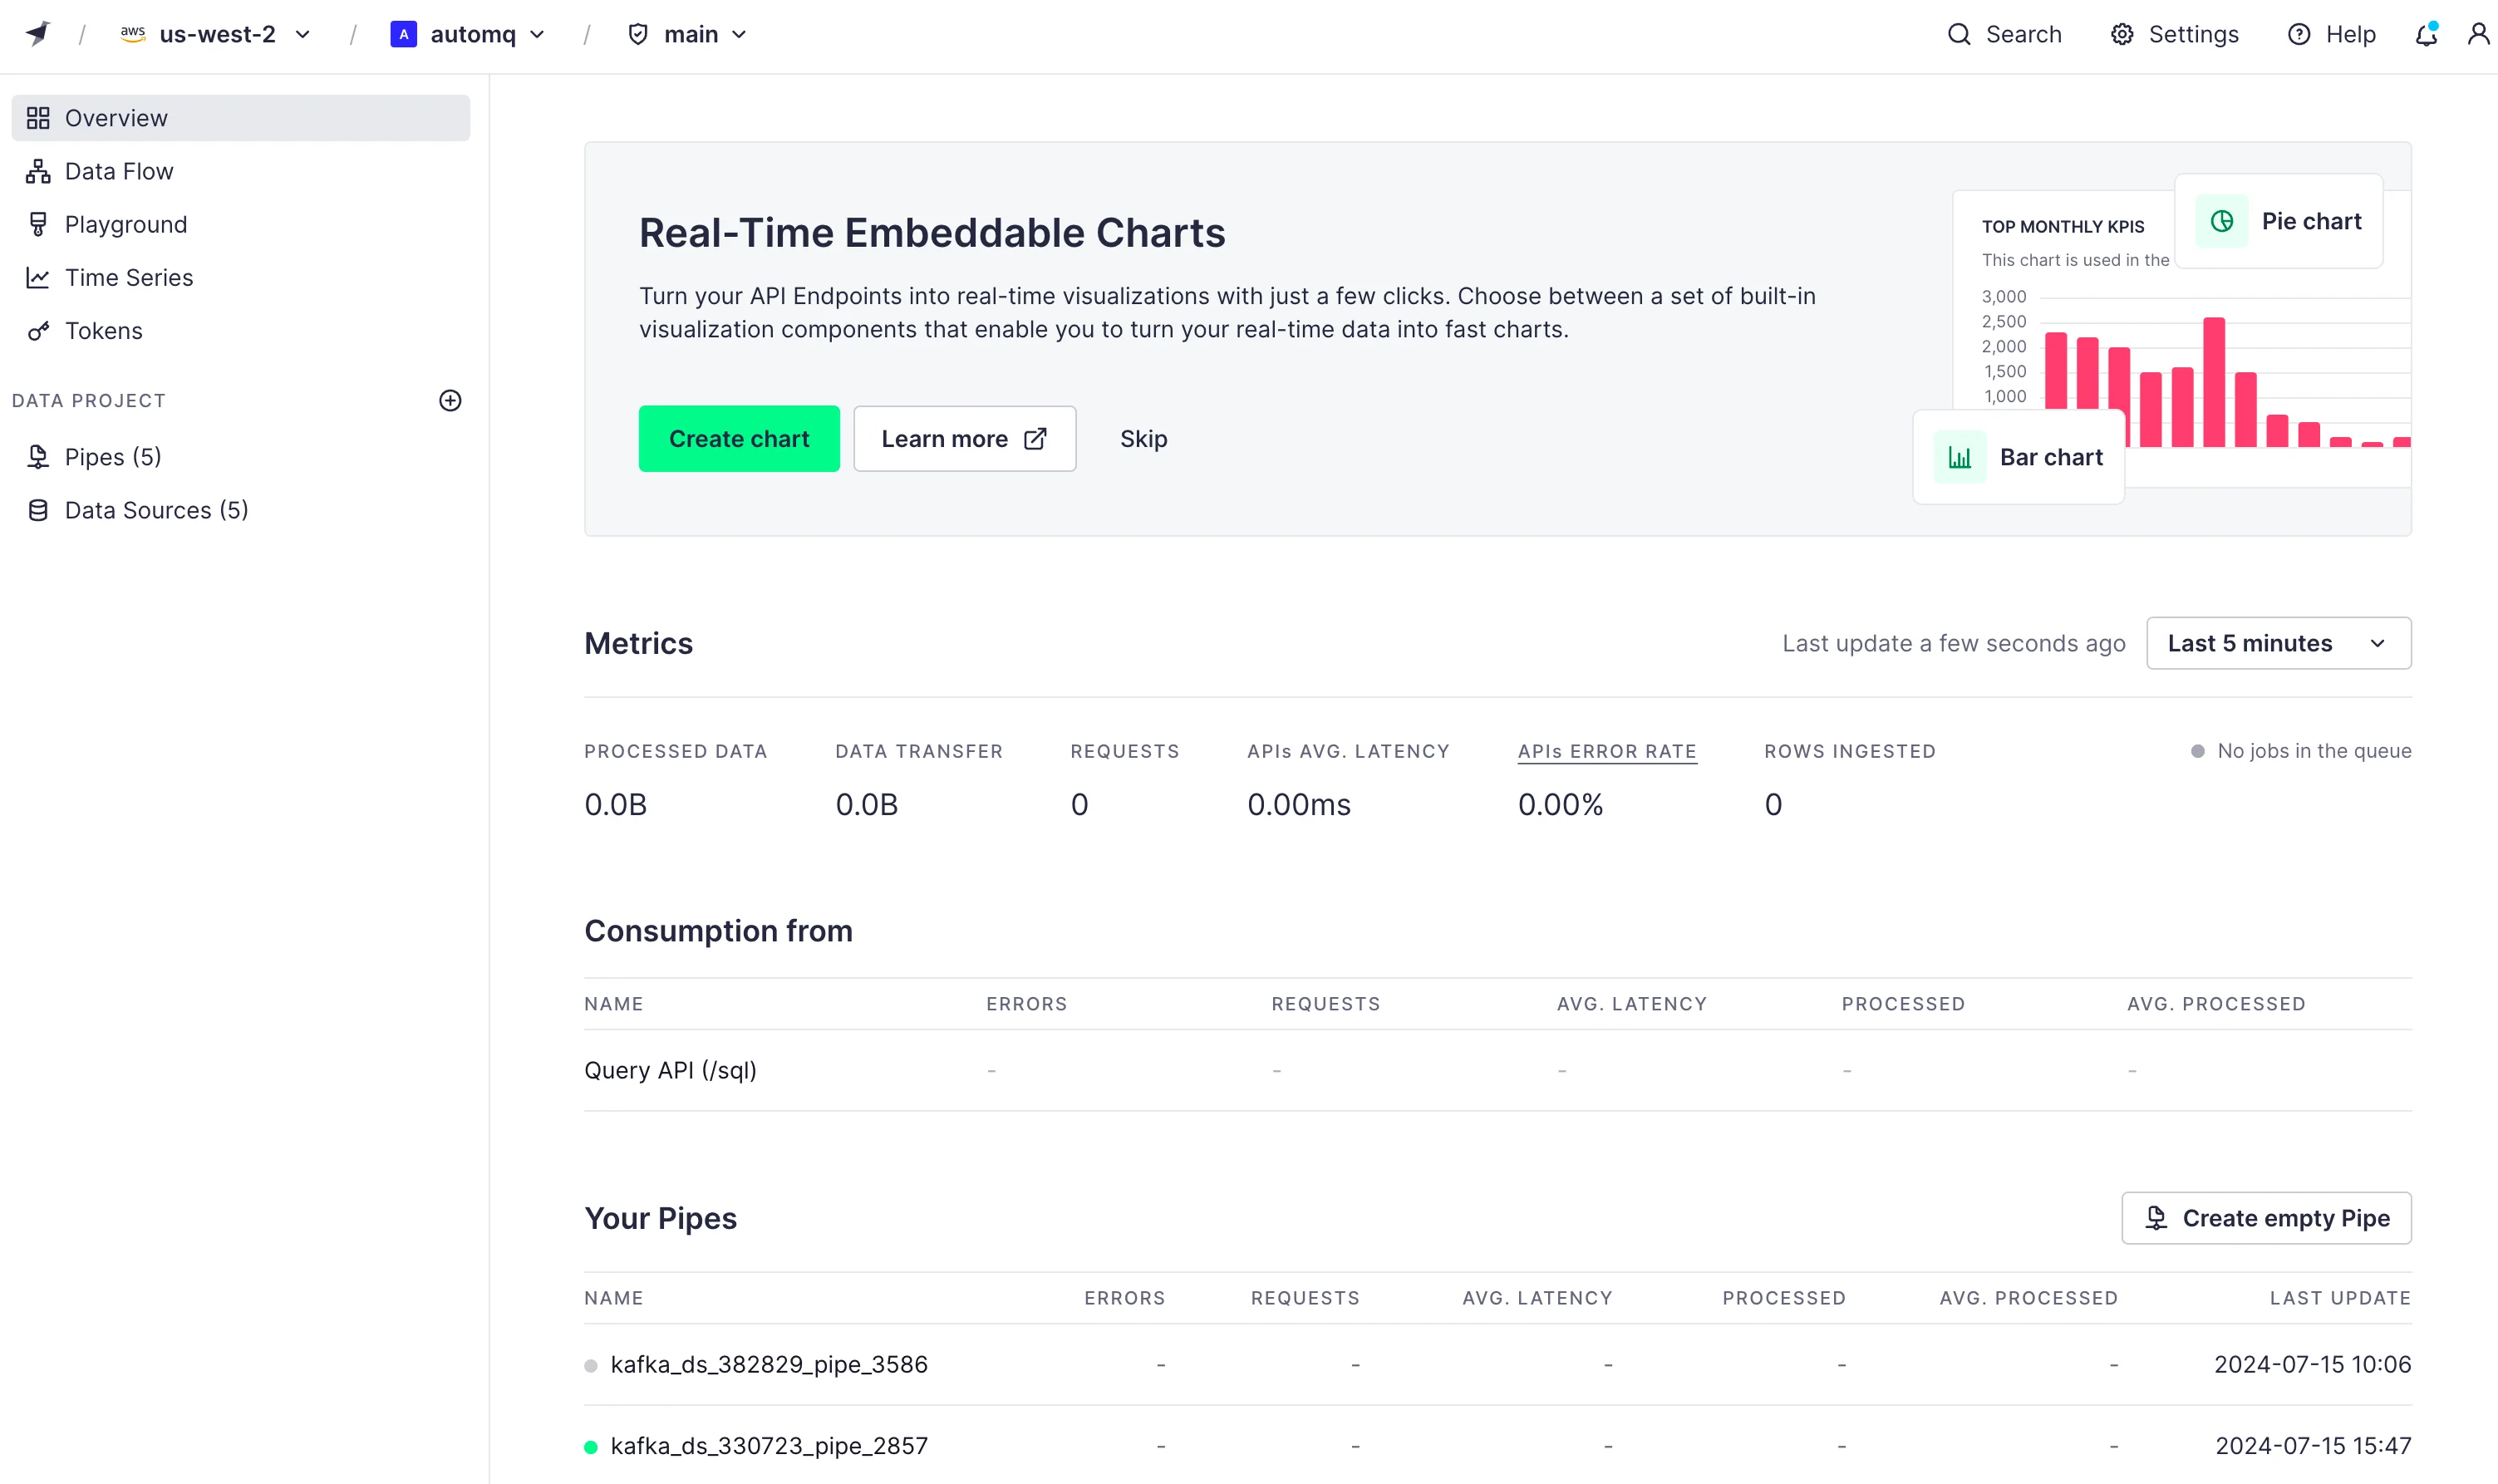
First, we need to access the control panel provided on the official website as follows:
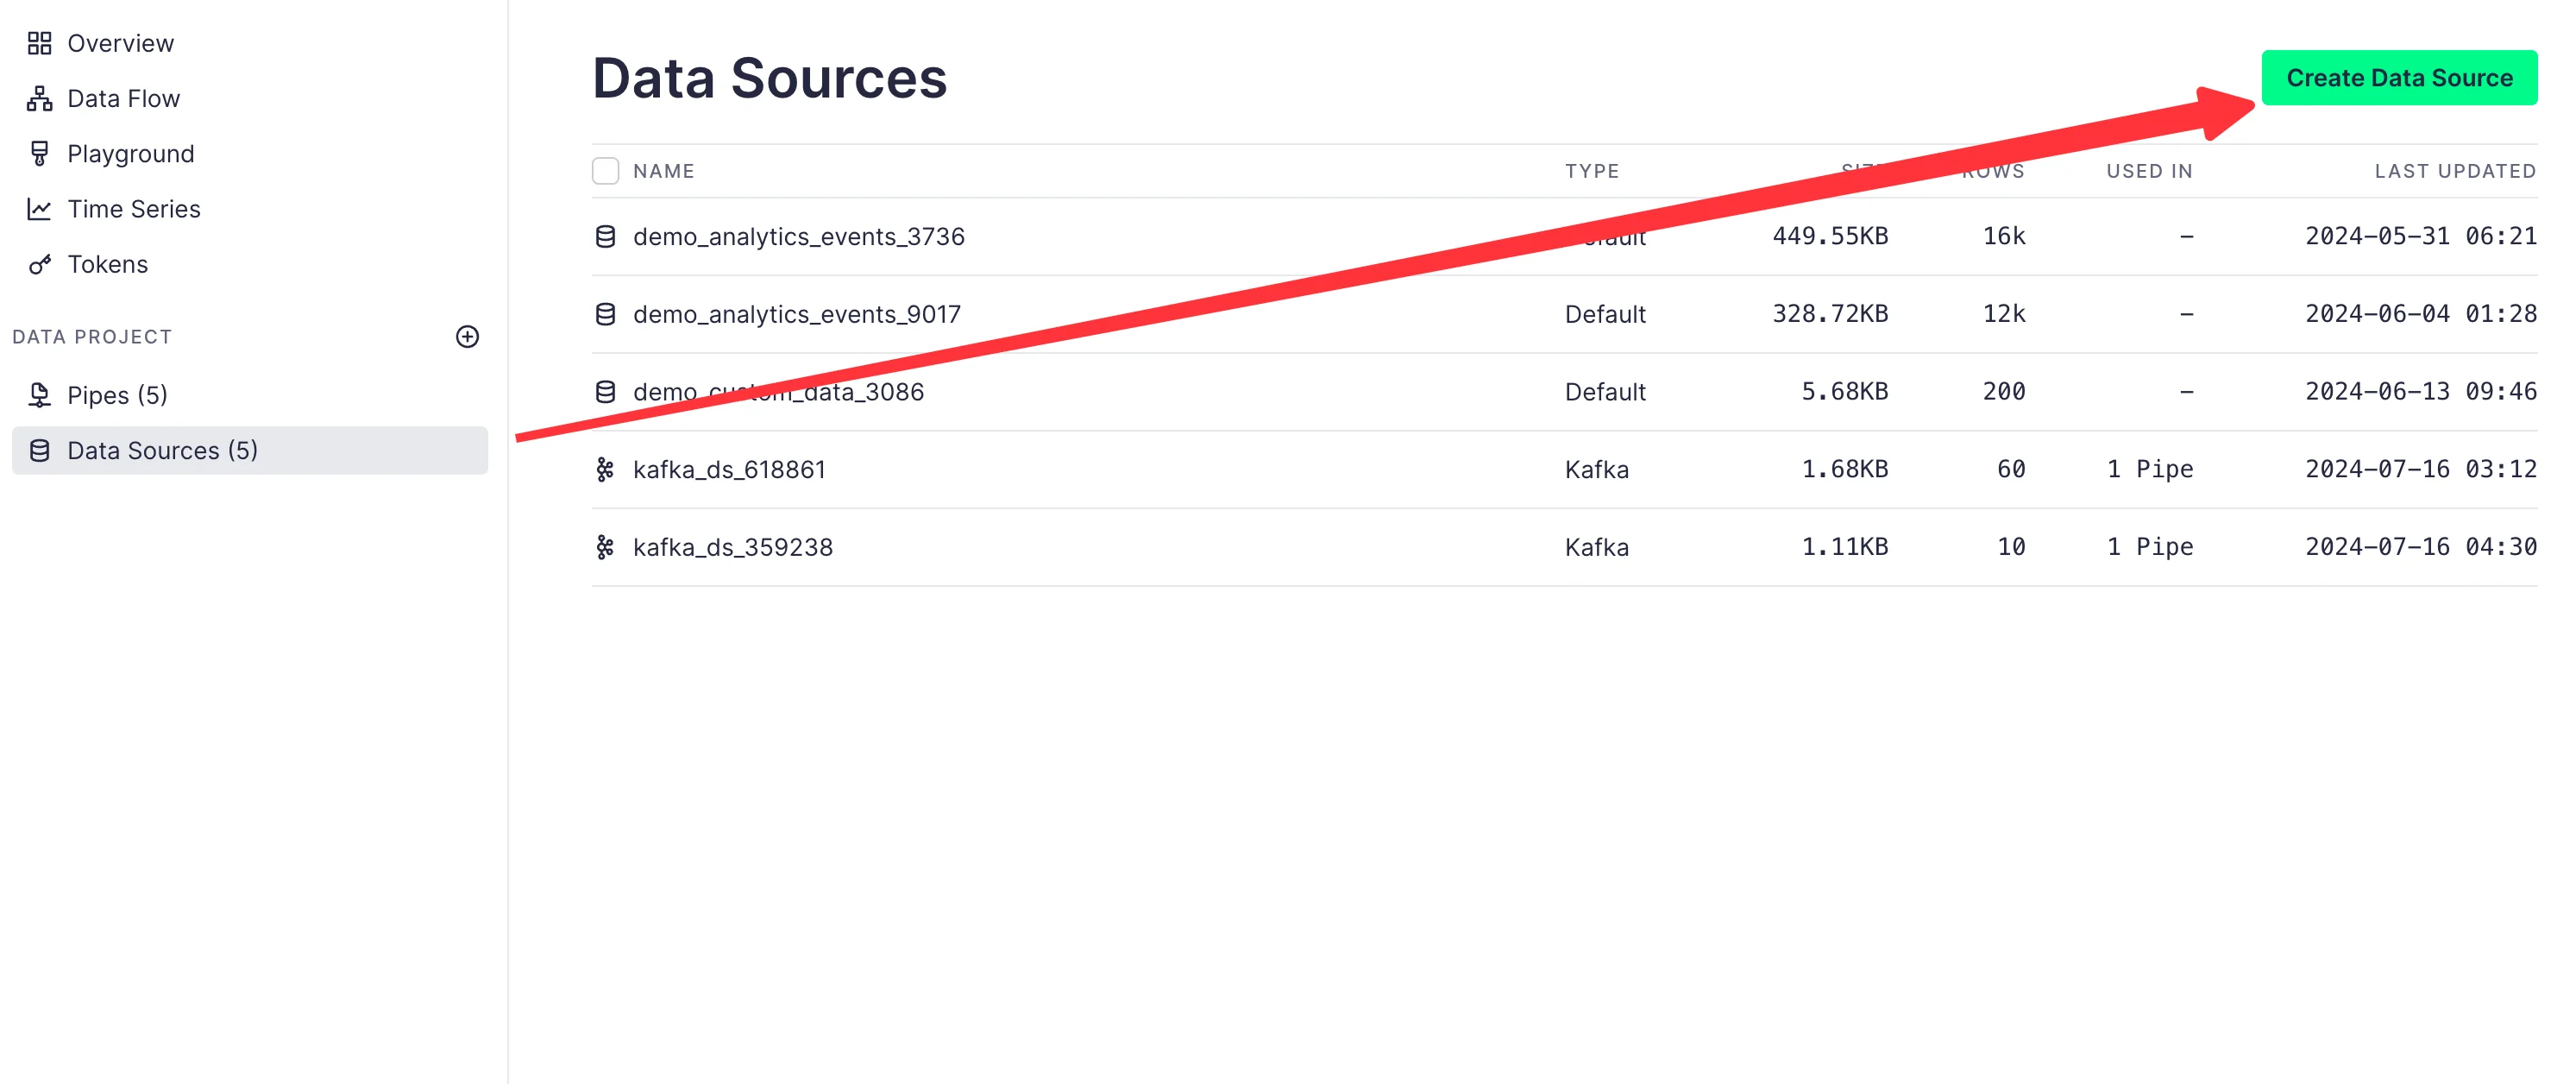
Click on the Data Sources tab in the menu bar, then click Create Data Source:
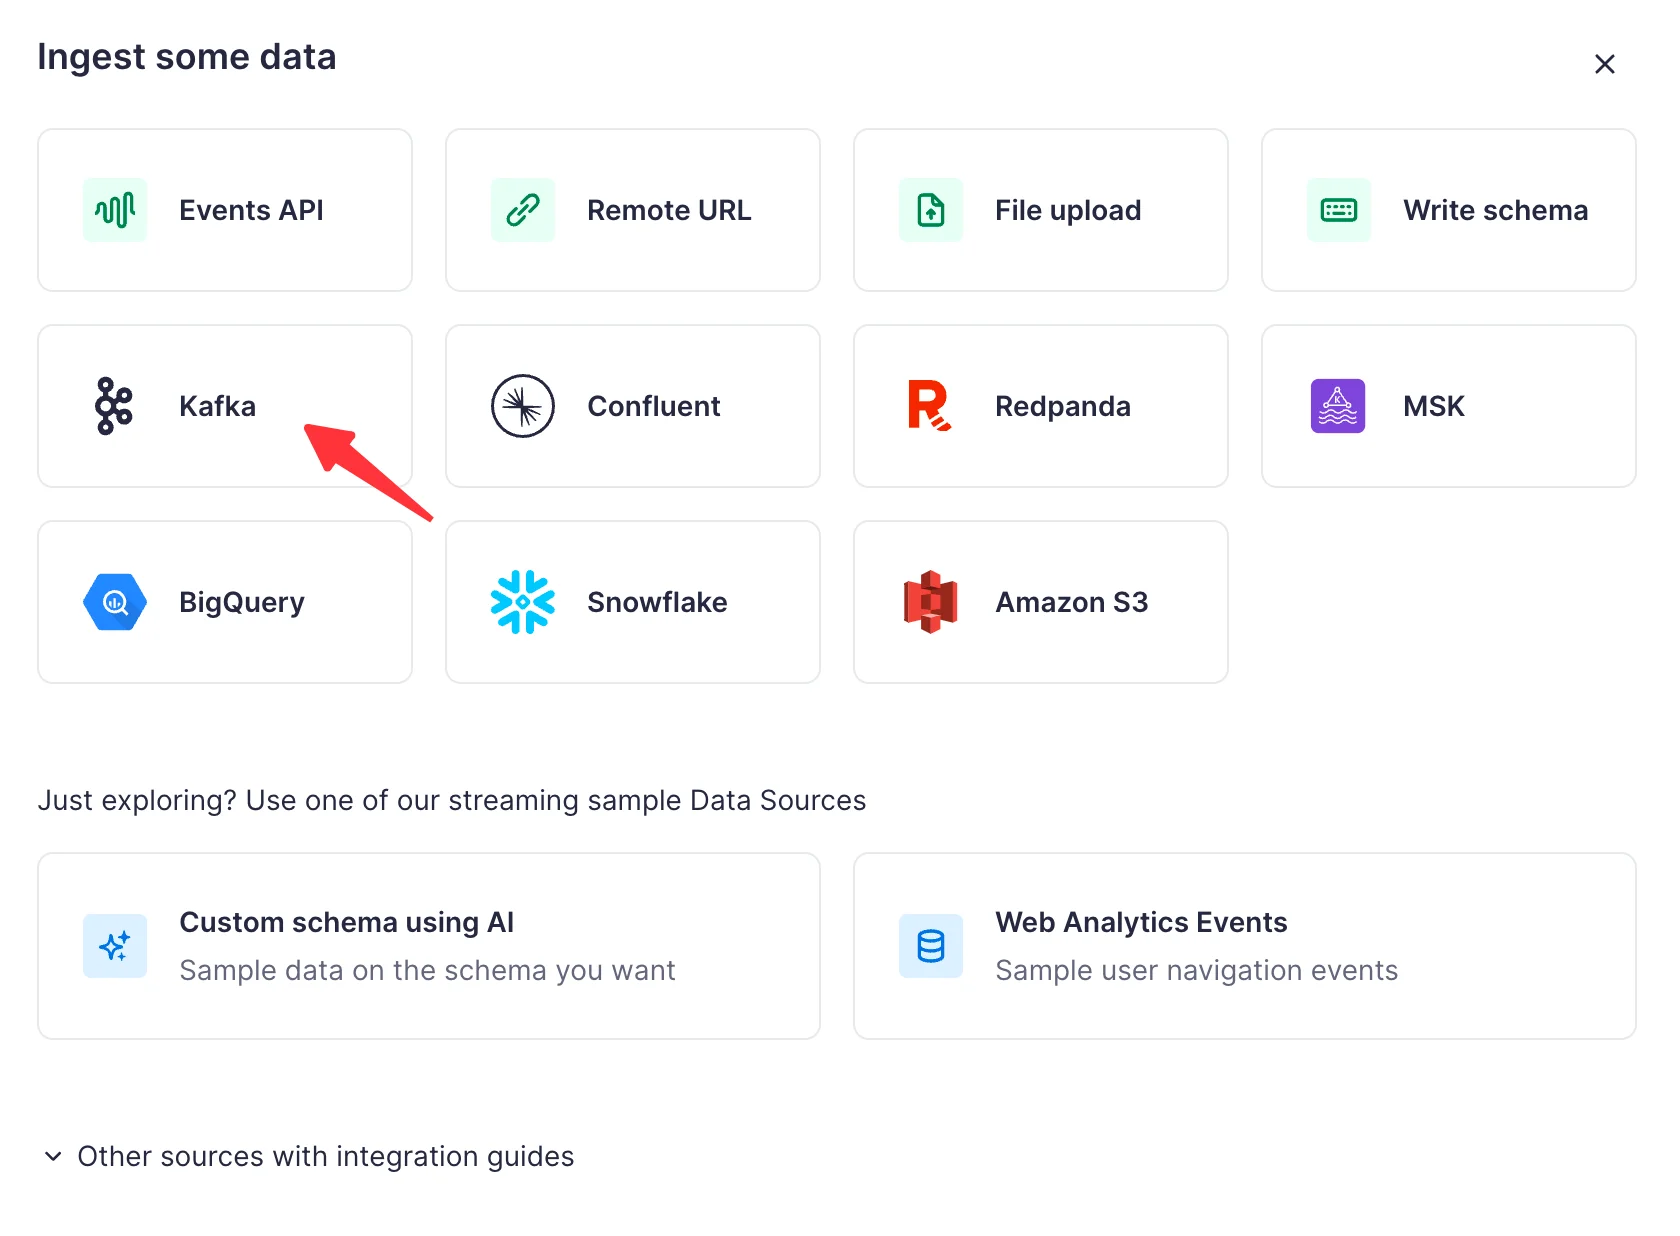
Since AutoMQ is 100% compatible with Kafka, we can click to import data in Kafka format:
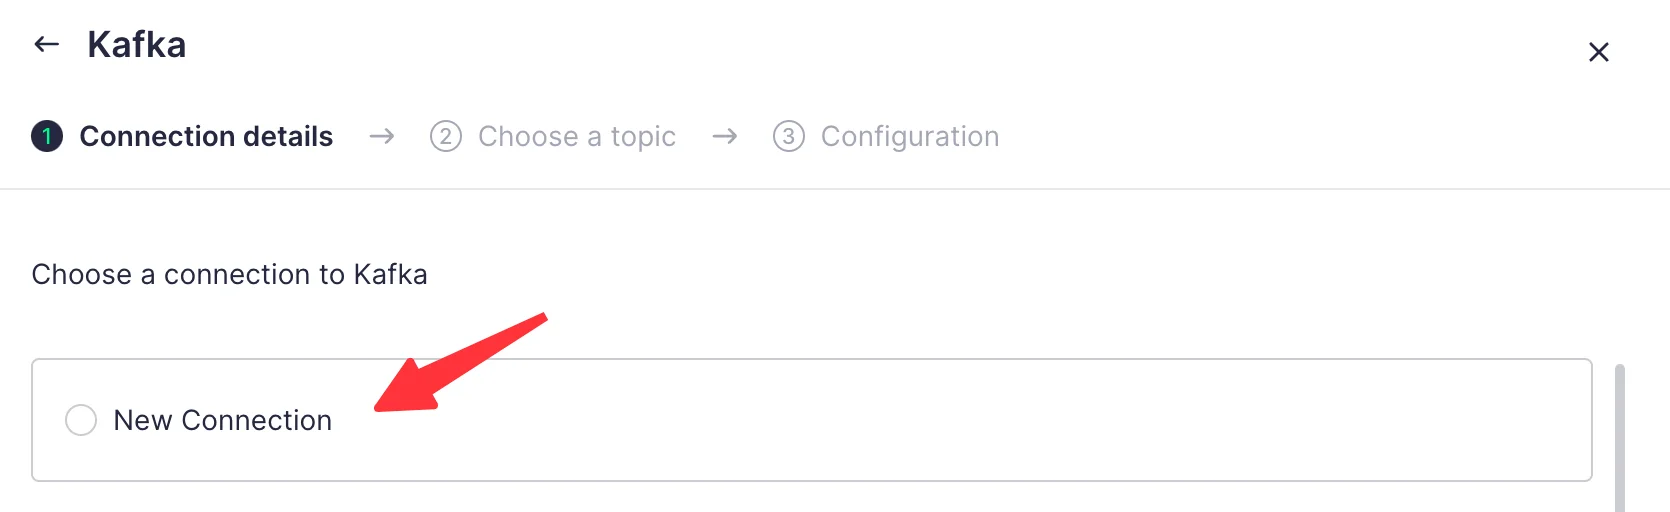
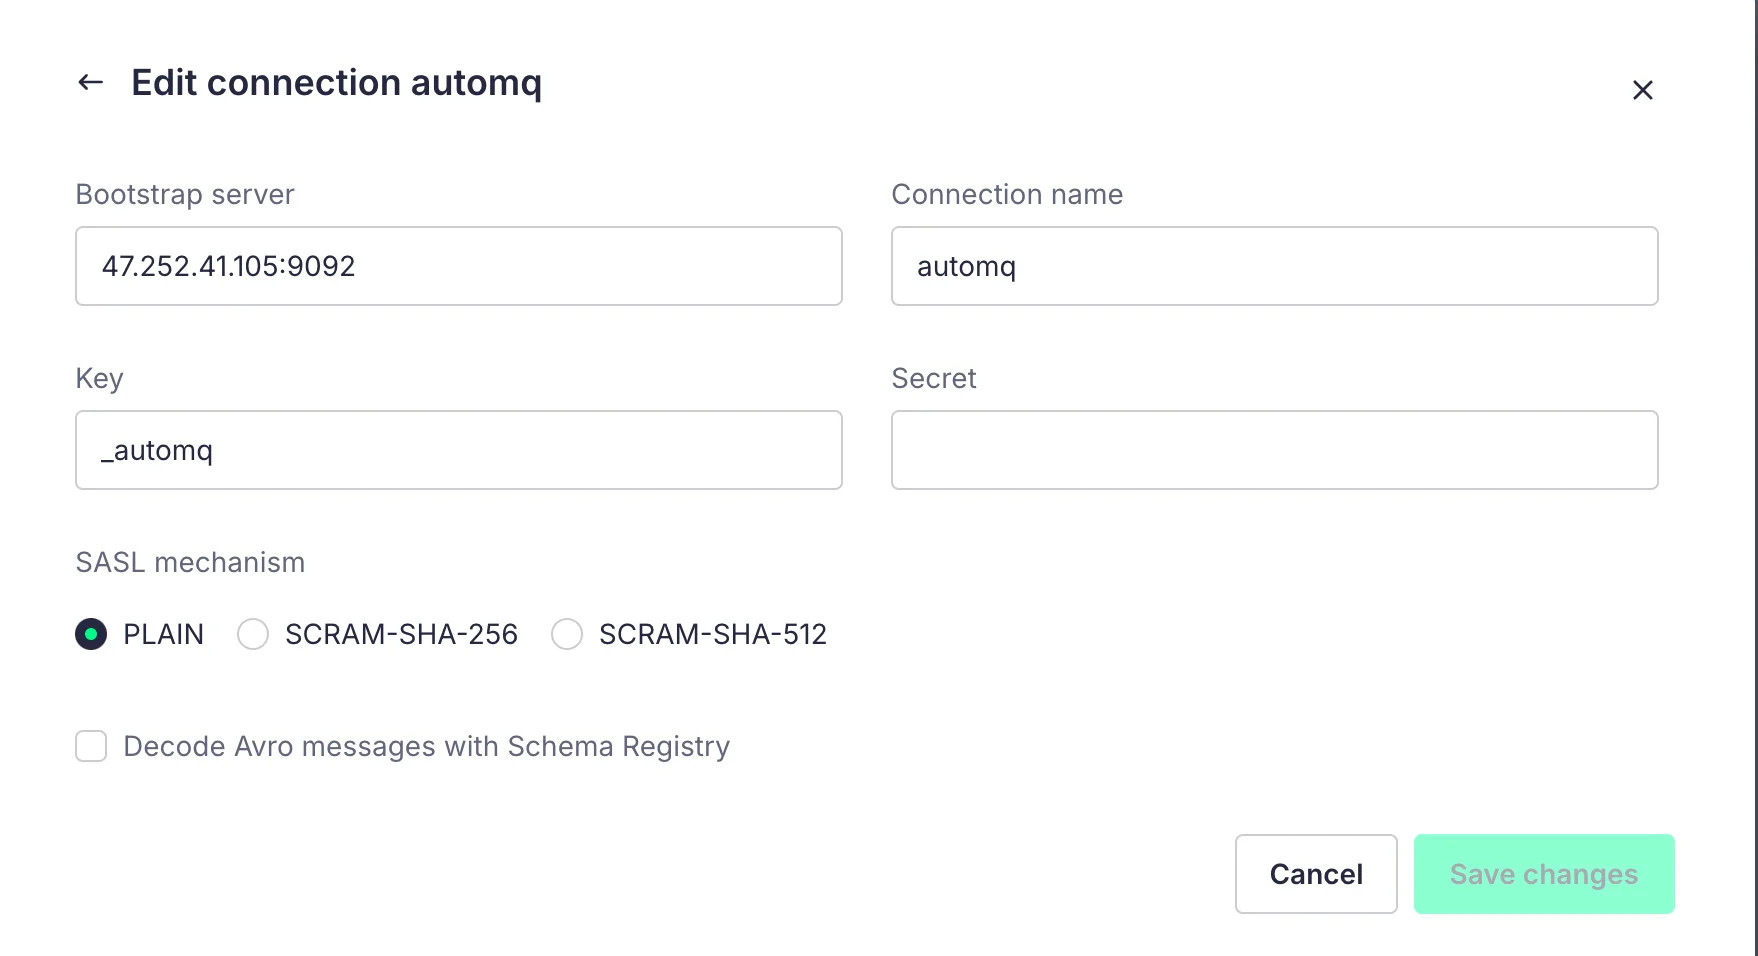
Click to create a new connection and enter our cluster configuration:
The Key and Secret are the username and password for the SASL configuration of our cluster.
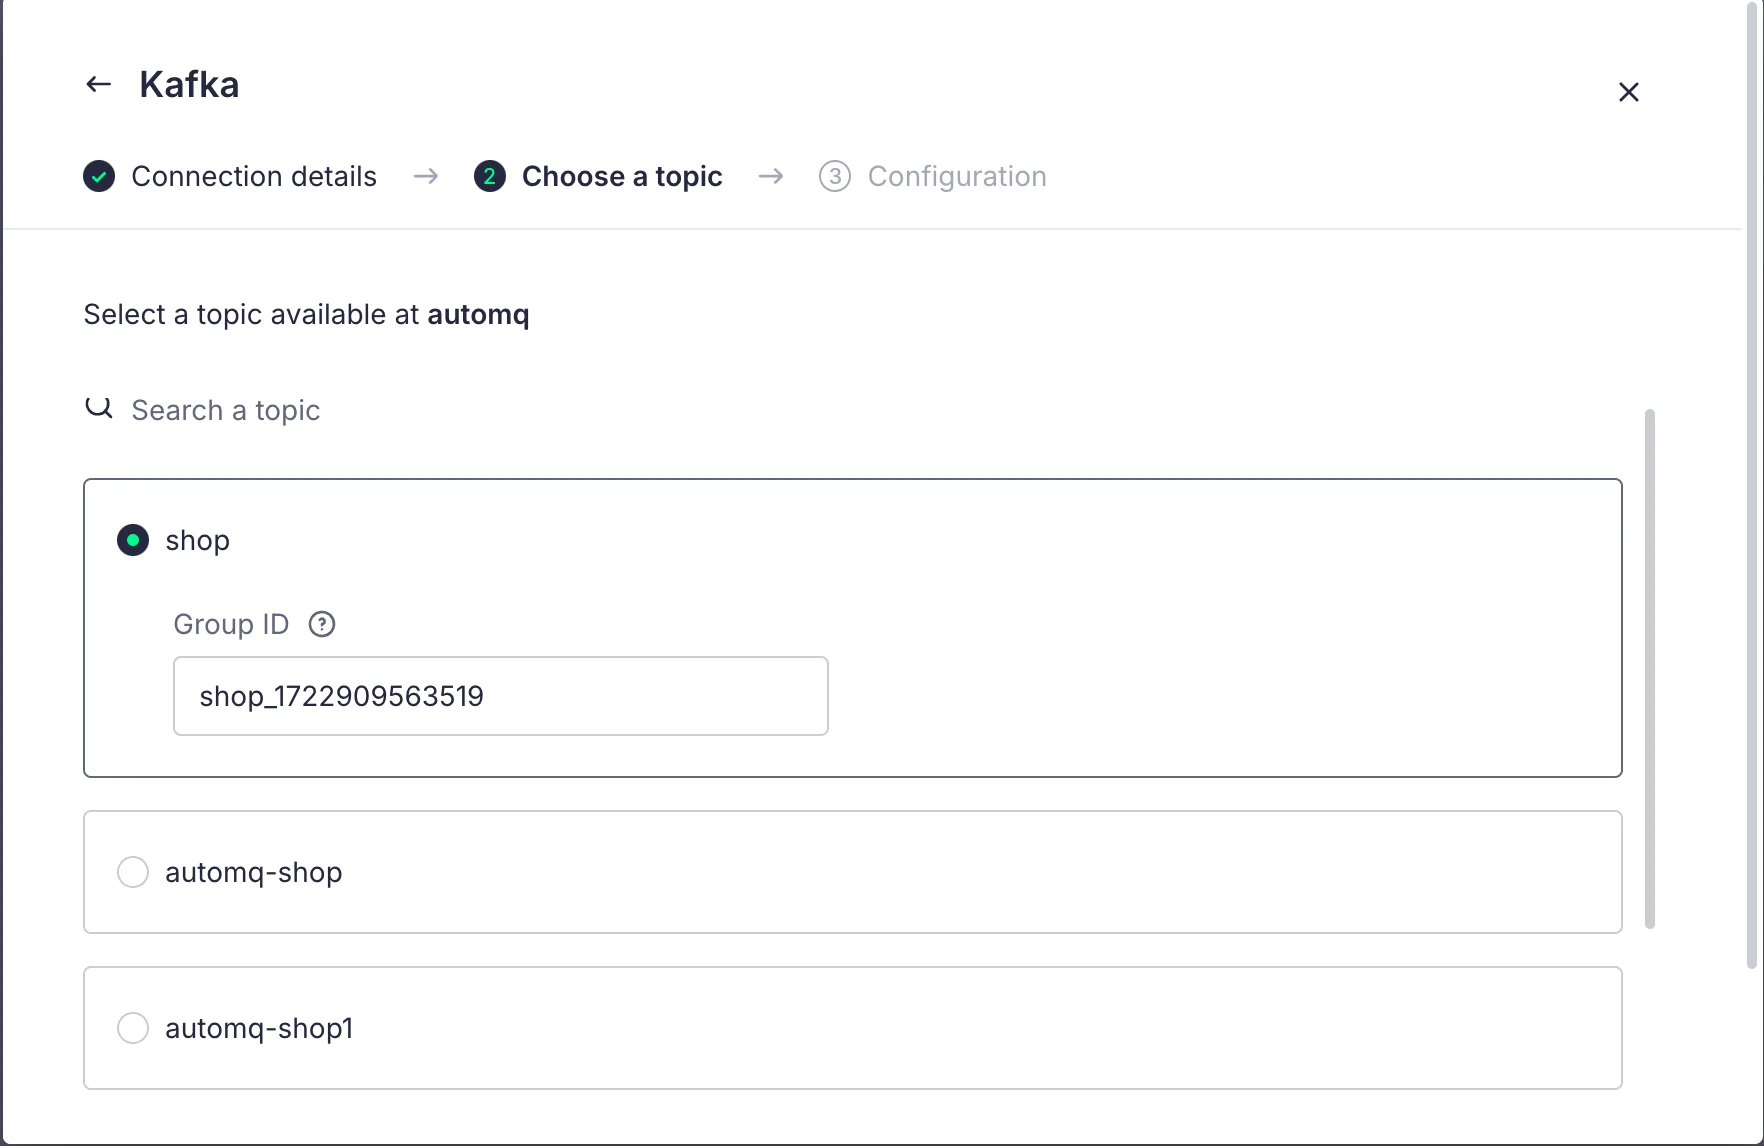
After the configuration is complete, we can click Next to choose the Topic:
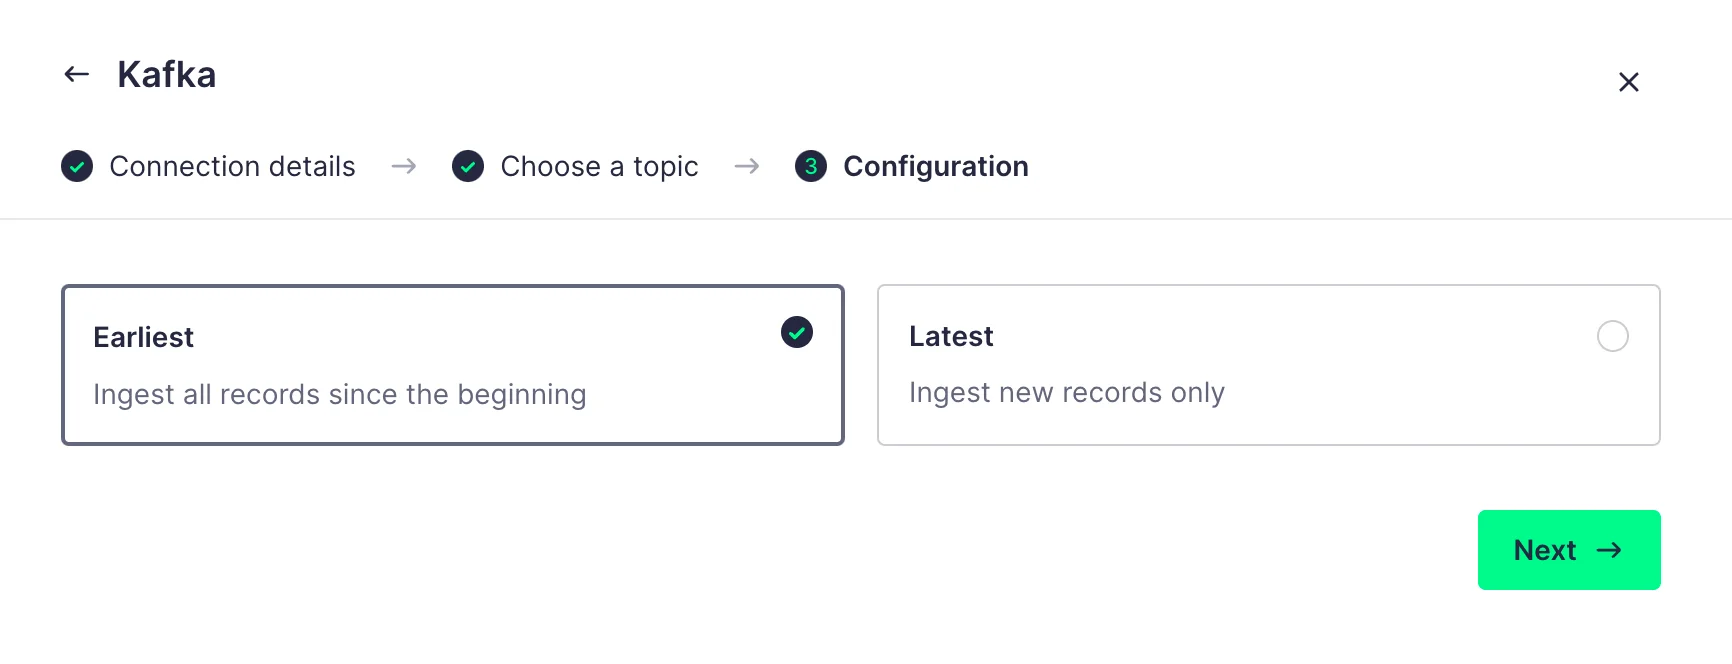
In the next step of the configuration, we can choose to either retrieve all records from the beginning or only the records added after the data source is created. Here, we choose the first option:
Once the configuration is complete, Tinybird will automatically parse the data format of the Topic and display it in a table format:
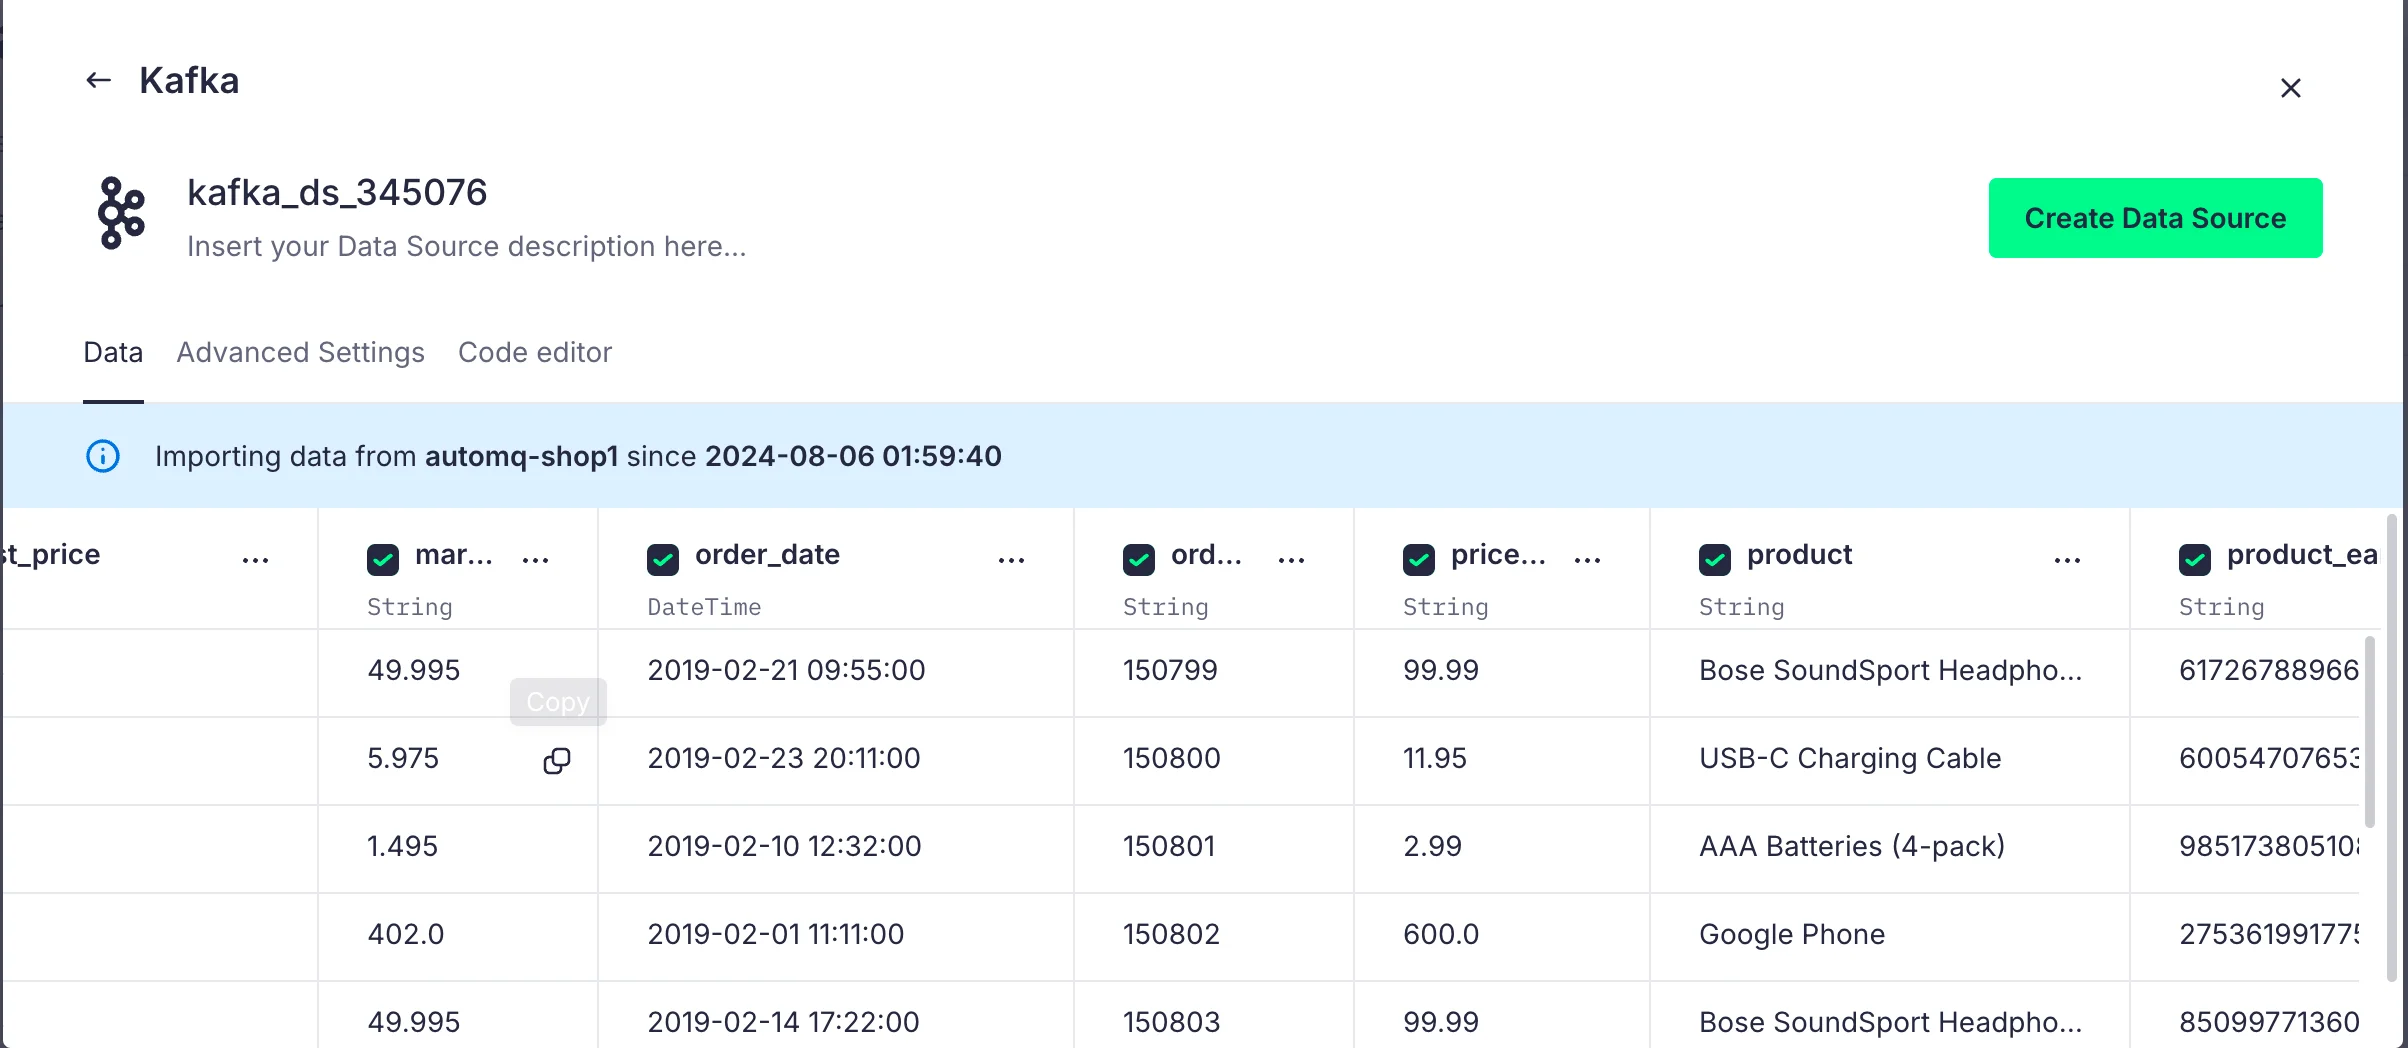
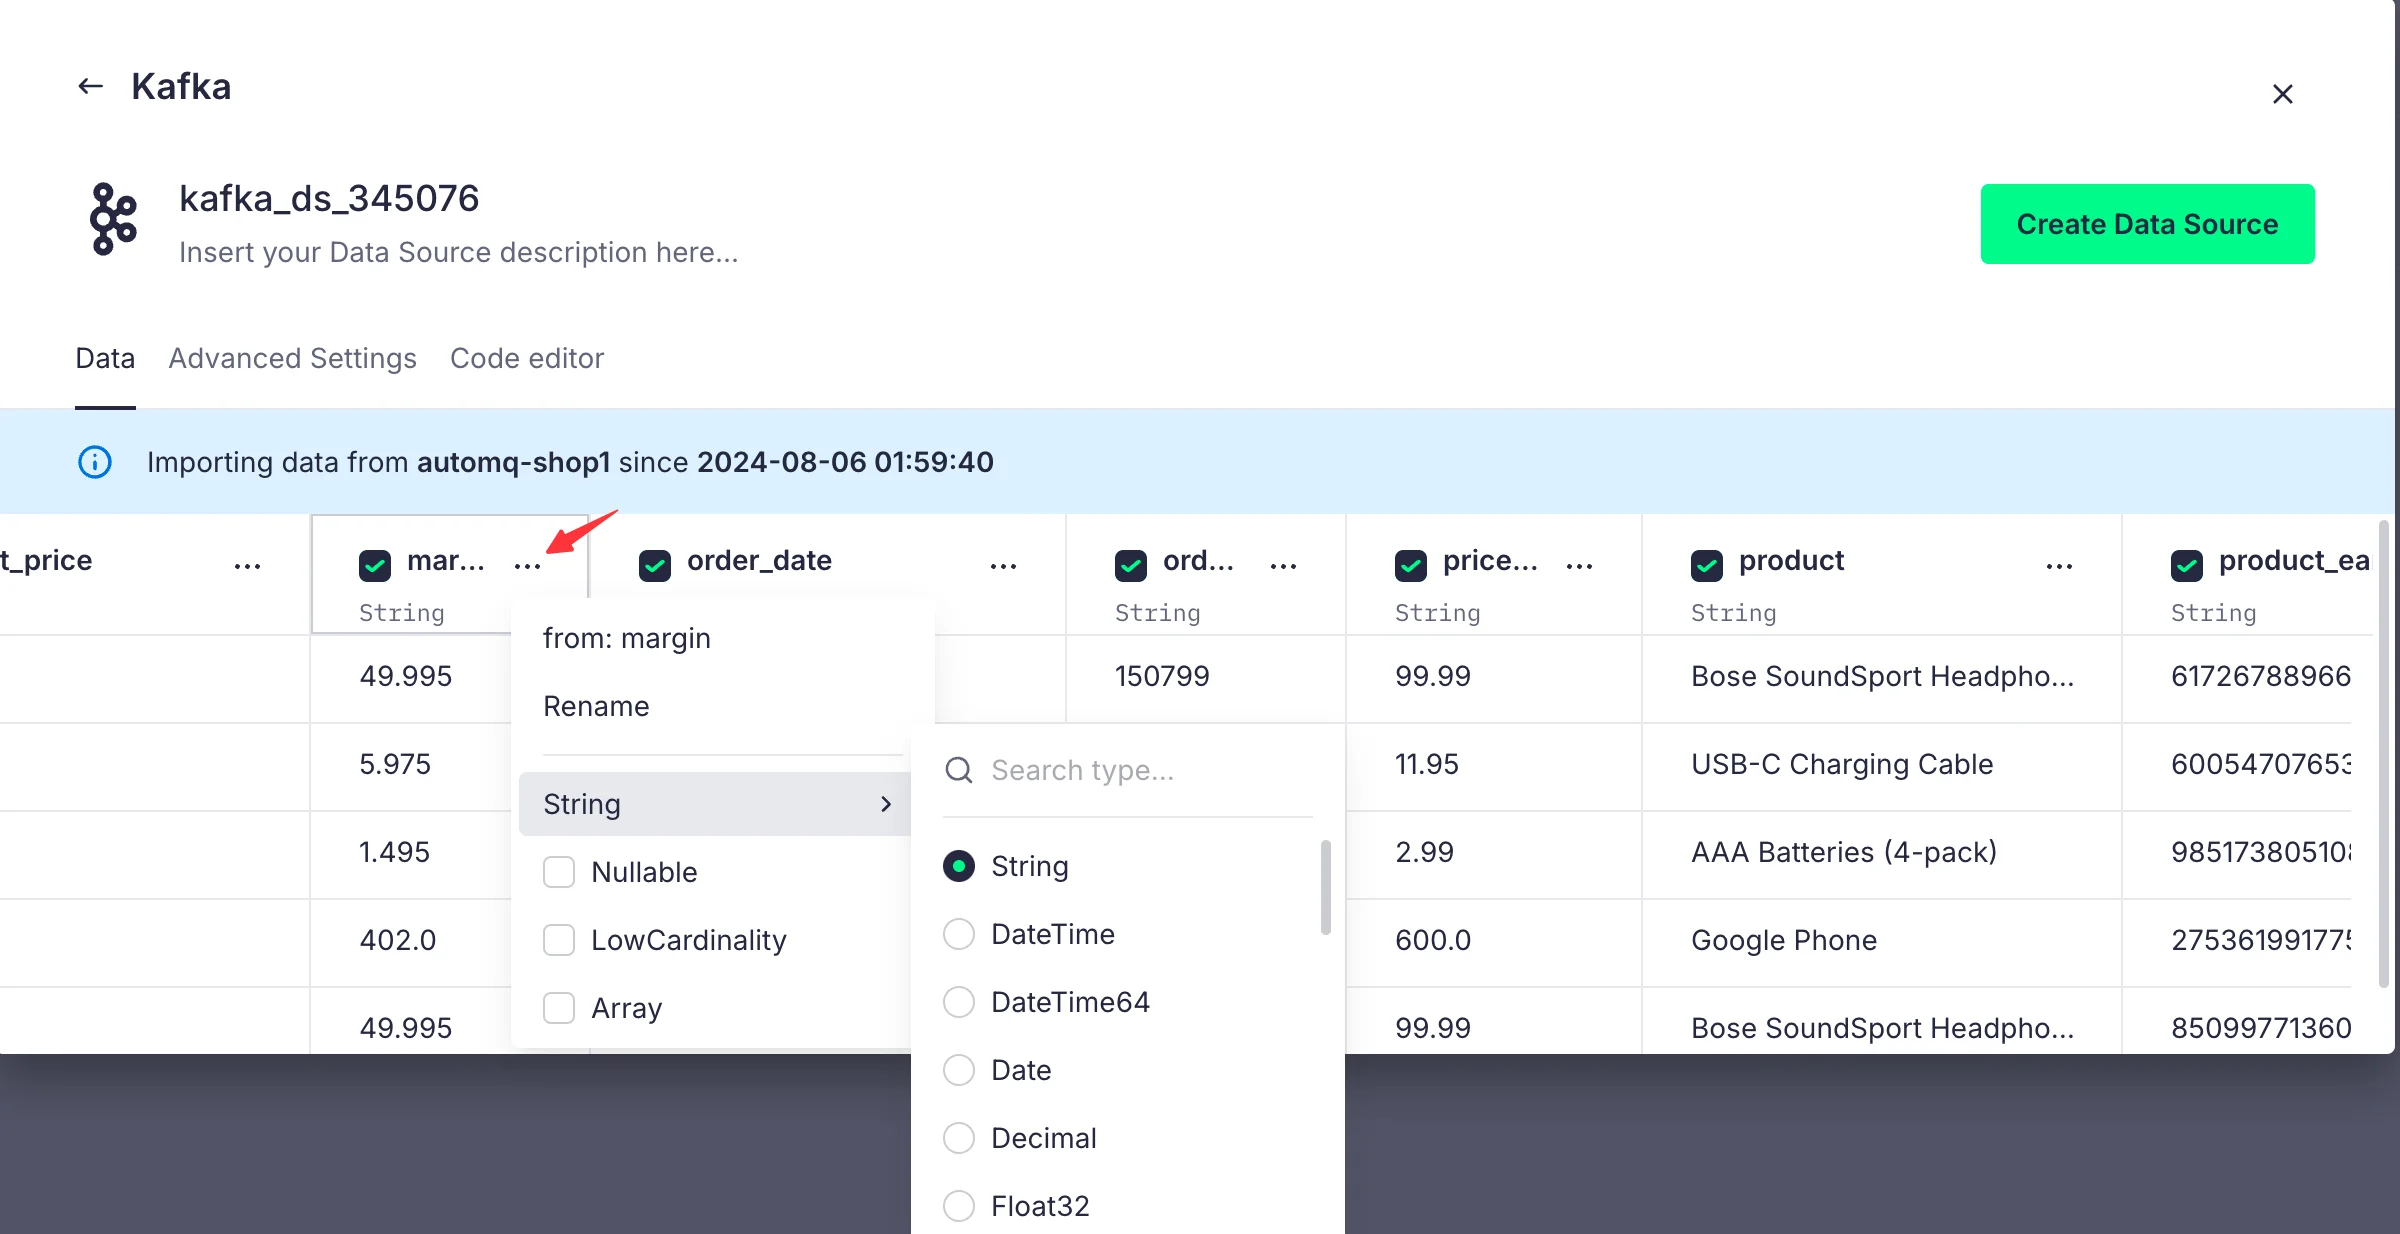
For parsing types that do not meet our expectations, we can also make adjustments, making it easier for us to perform SQL operations later on:
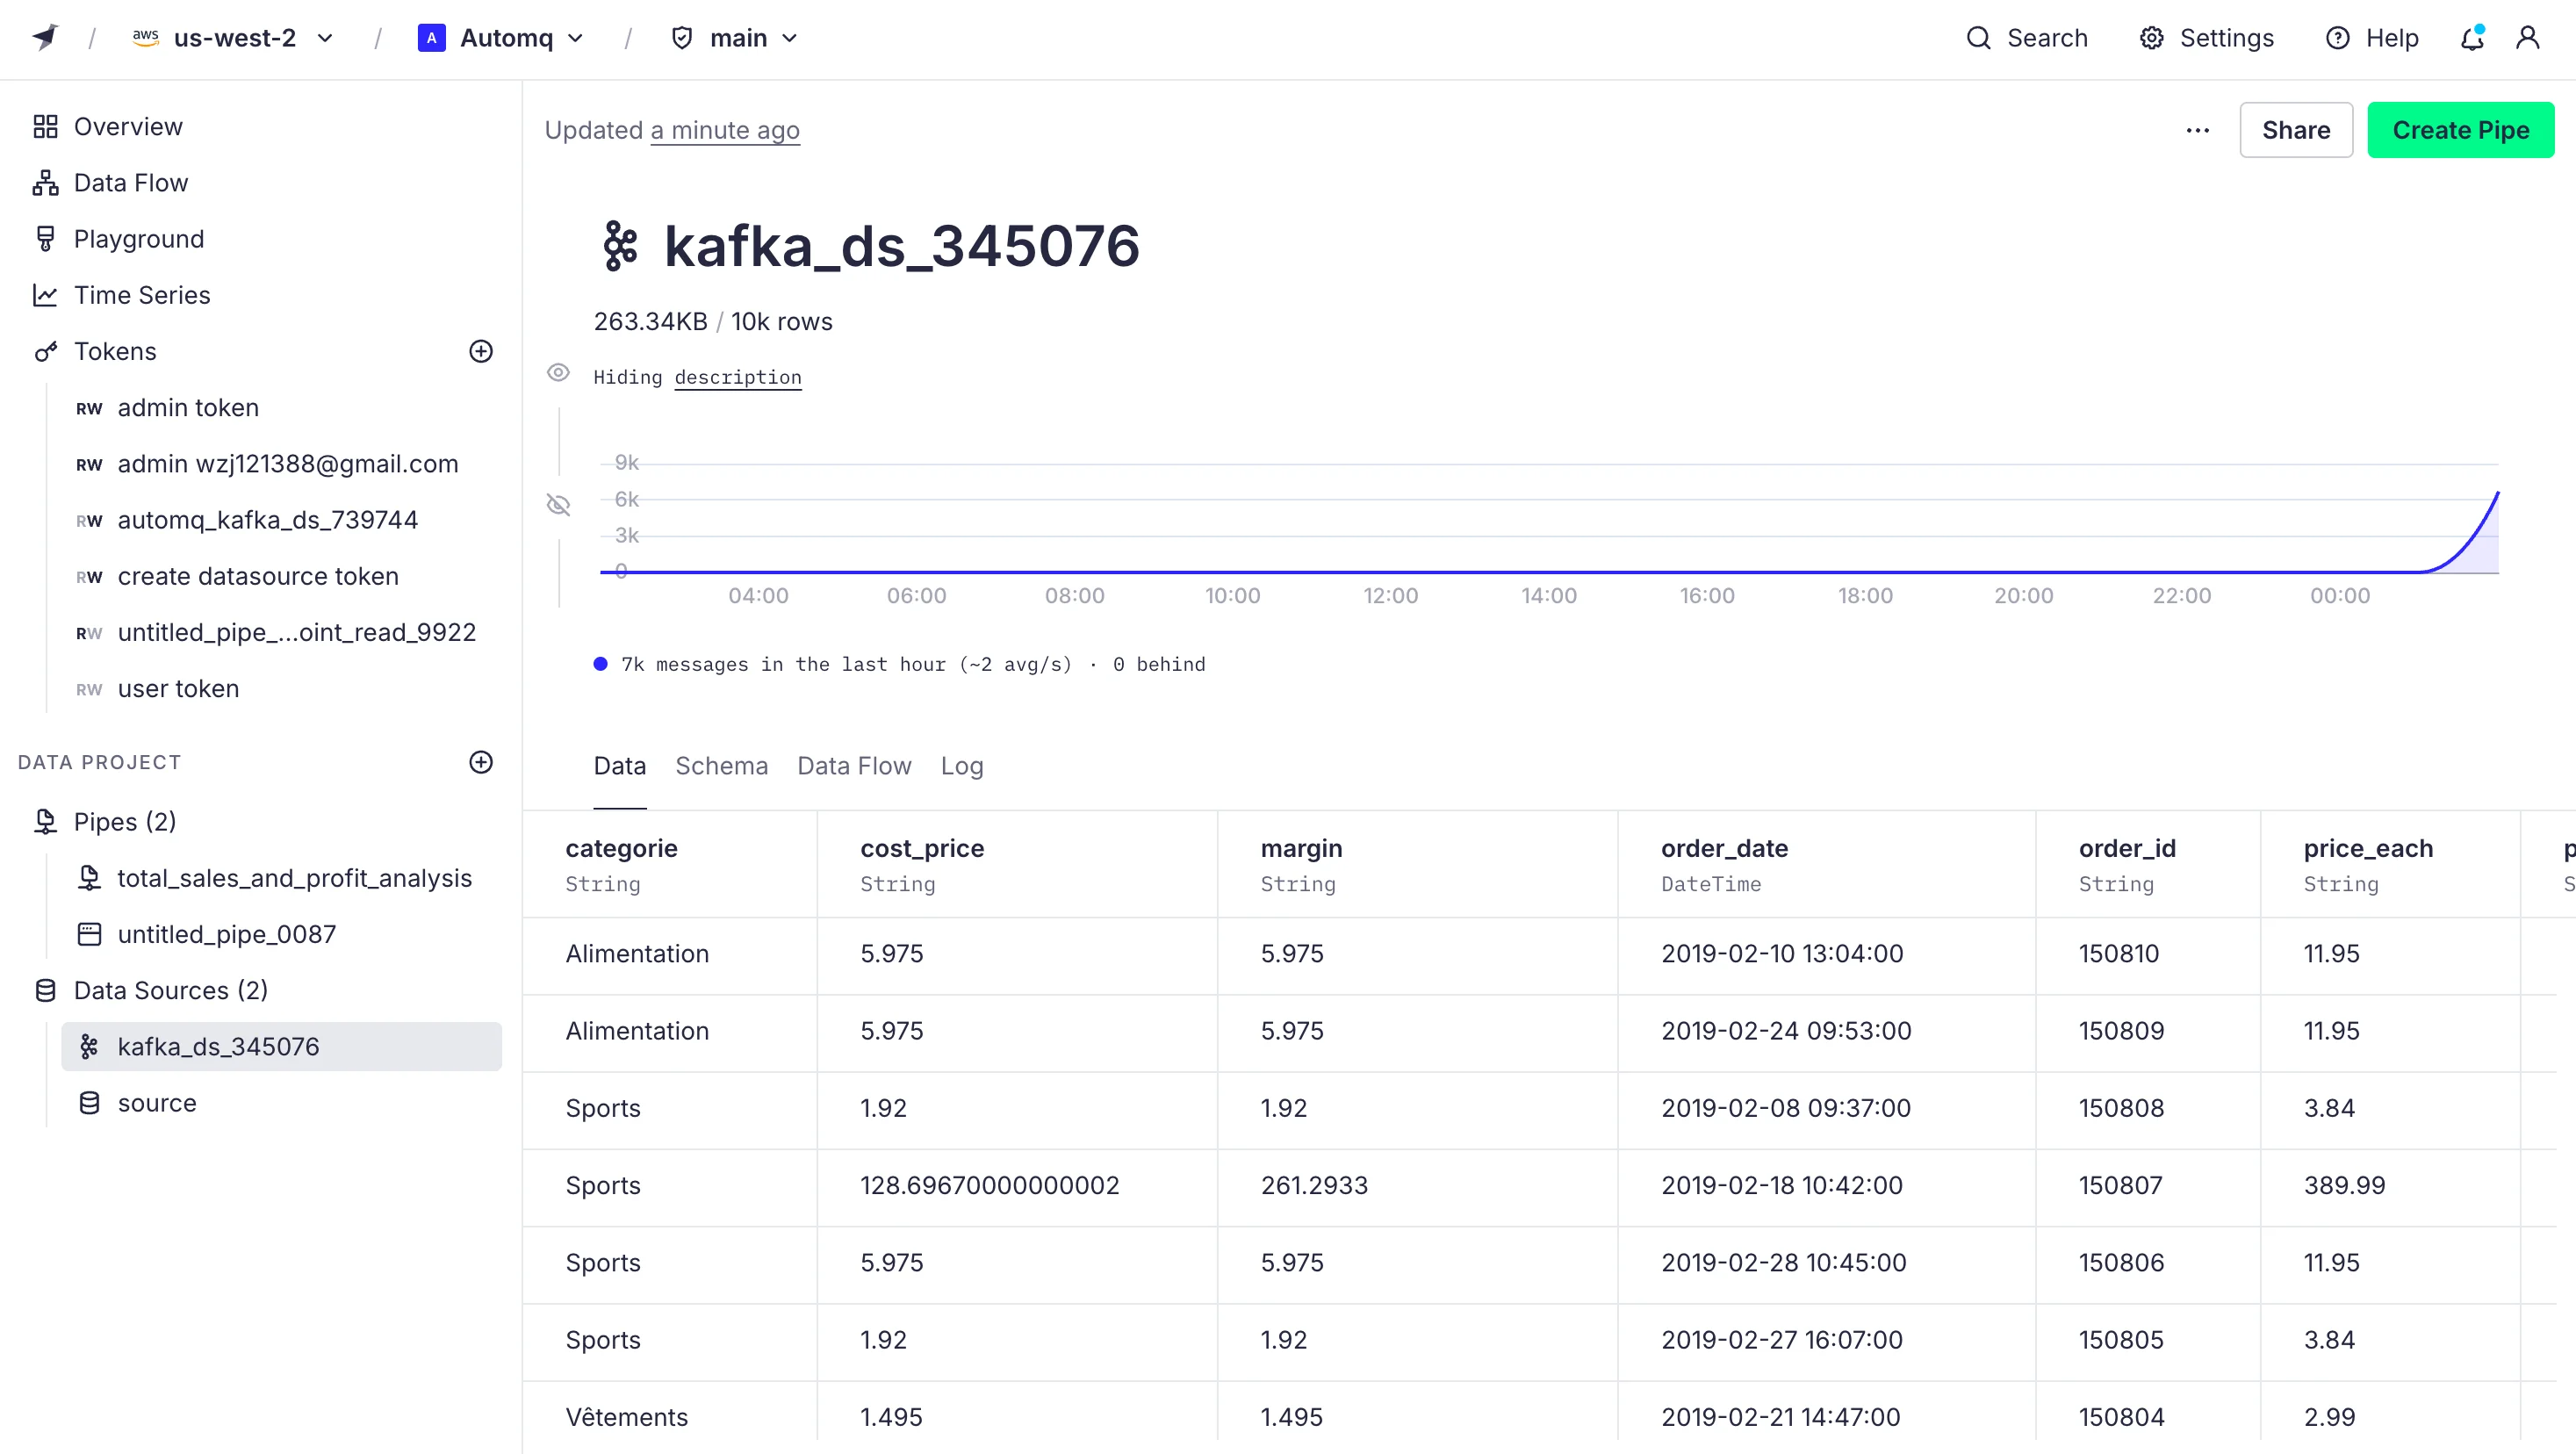
By clicking Create Data Source, we successfully connect AutoMQ's Topic with Tinybird. From now on, all data on this Topic will be received by Tinybird. The data source panel is shown below:
Creating Pipelines
Tinybird offers powerful SQL analytics capabilities that can be used for filtering, aggregating, and joining data. We can create pipelines to perform different SQL operations.
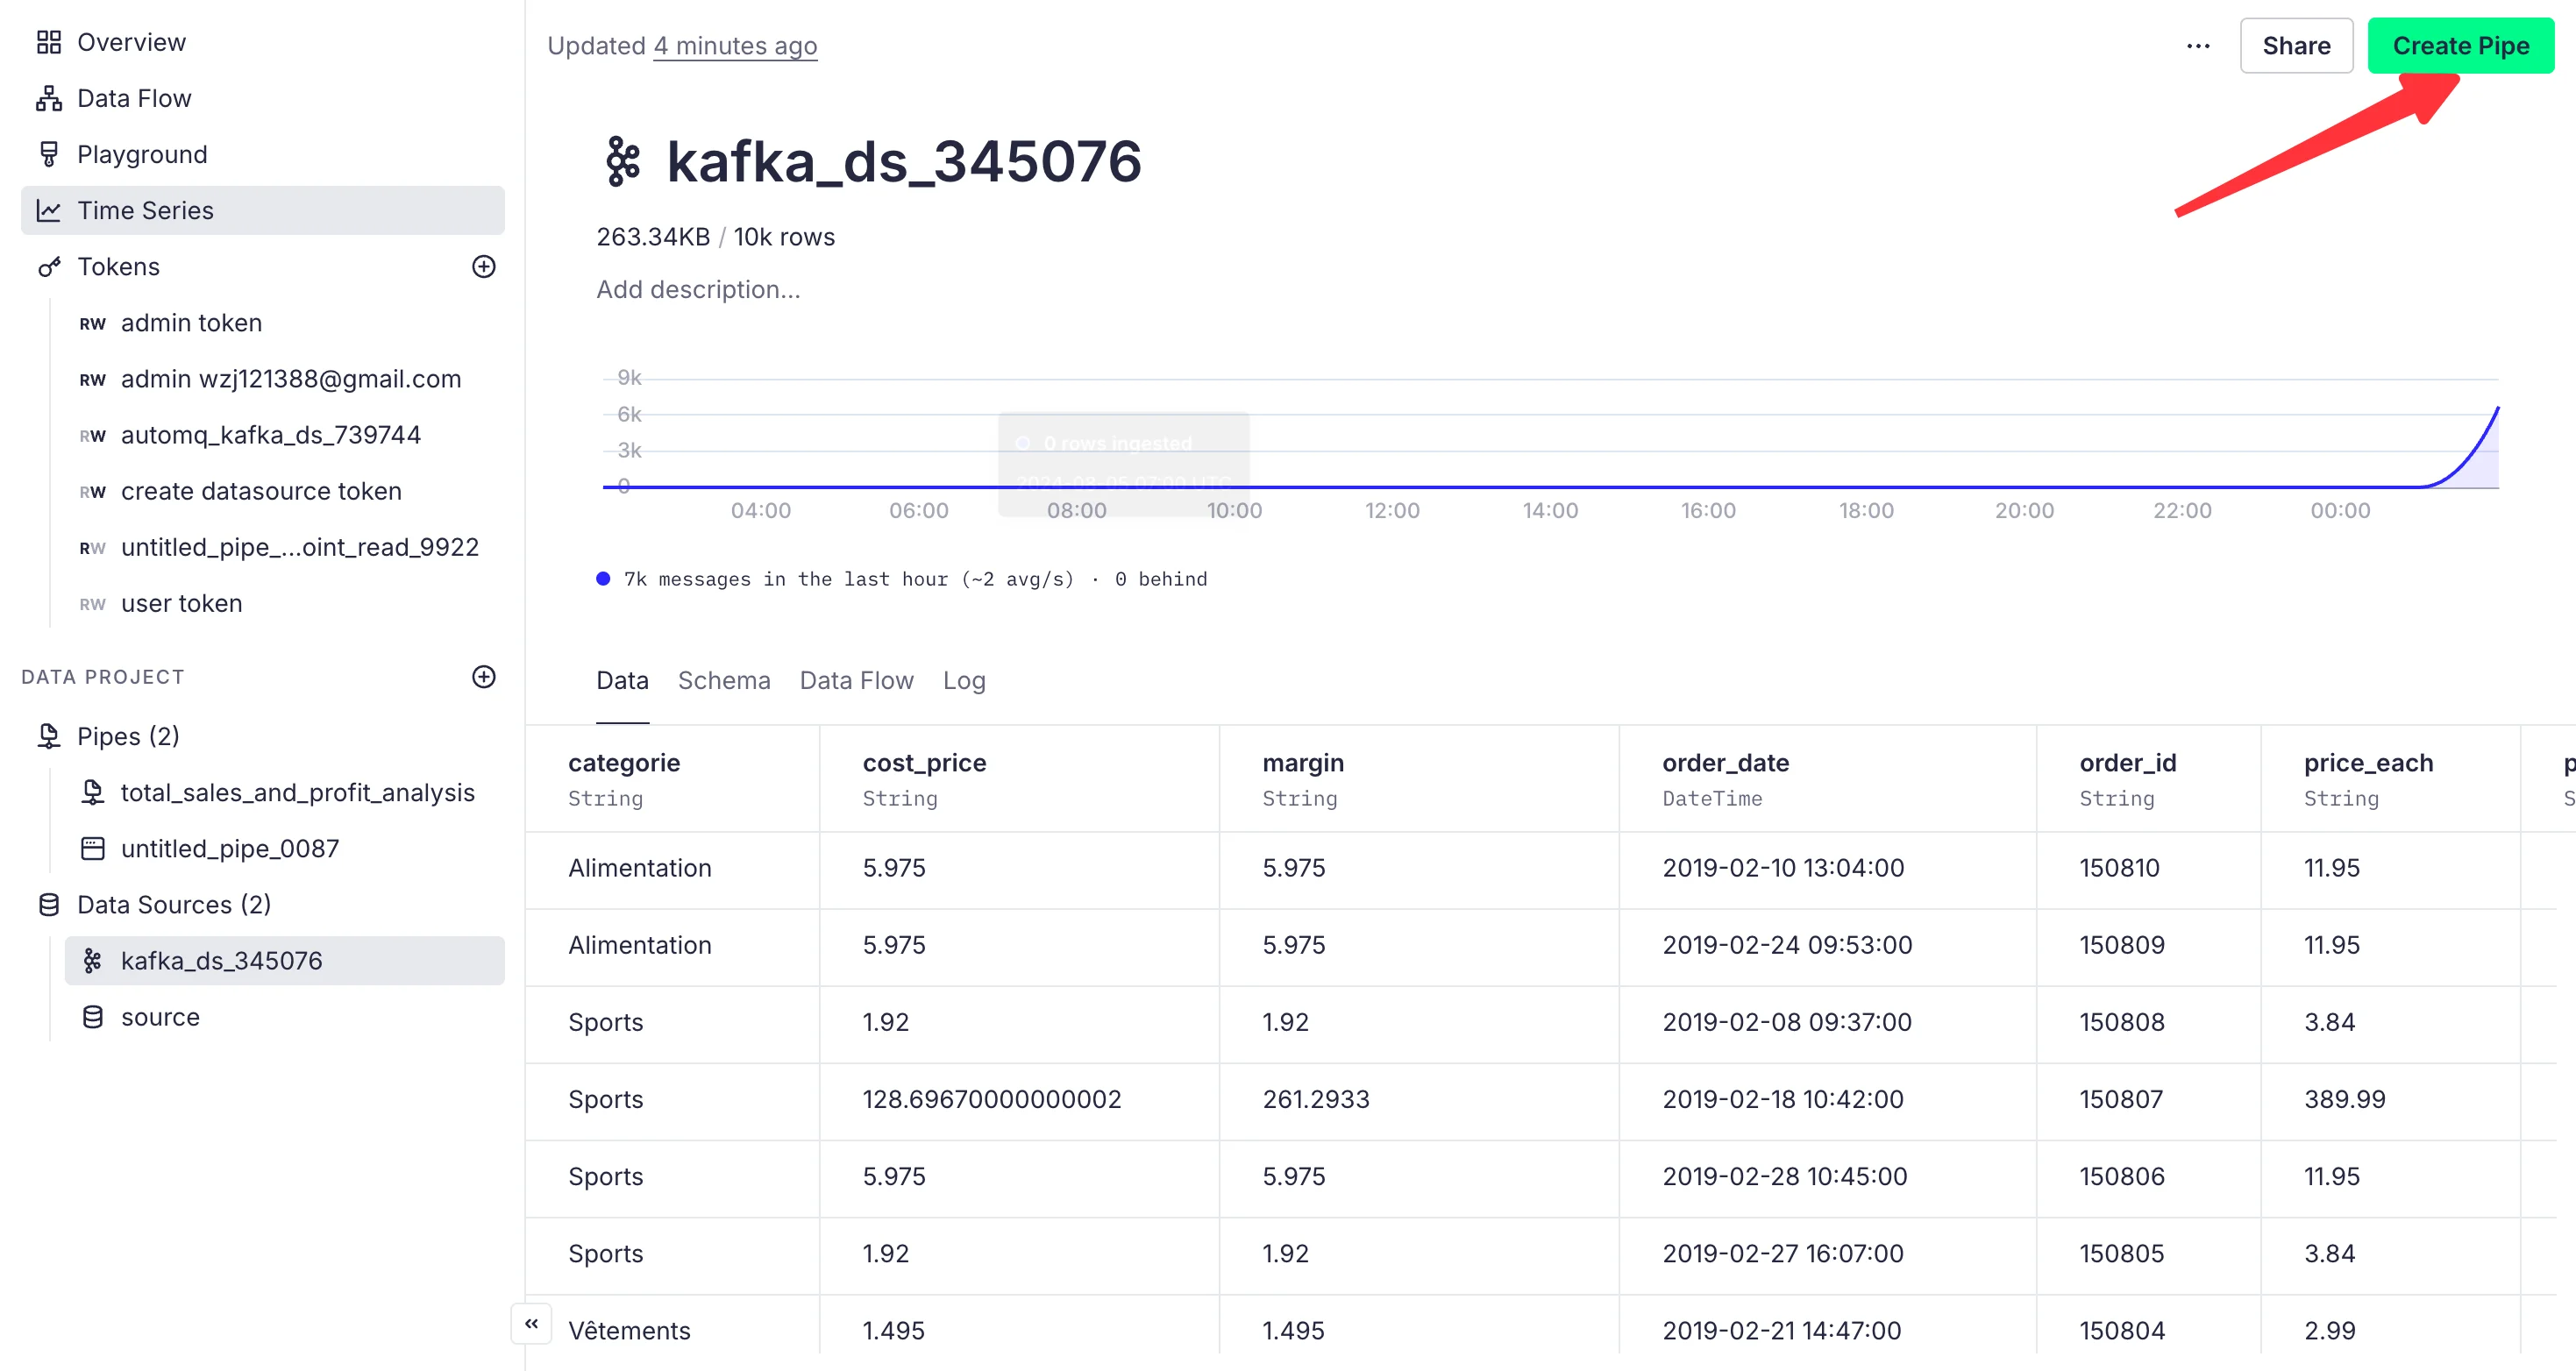
Click on the data source we just created, then click on Create Pipe on the page to create a pipeline:
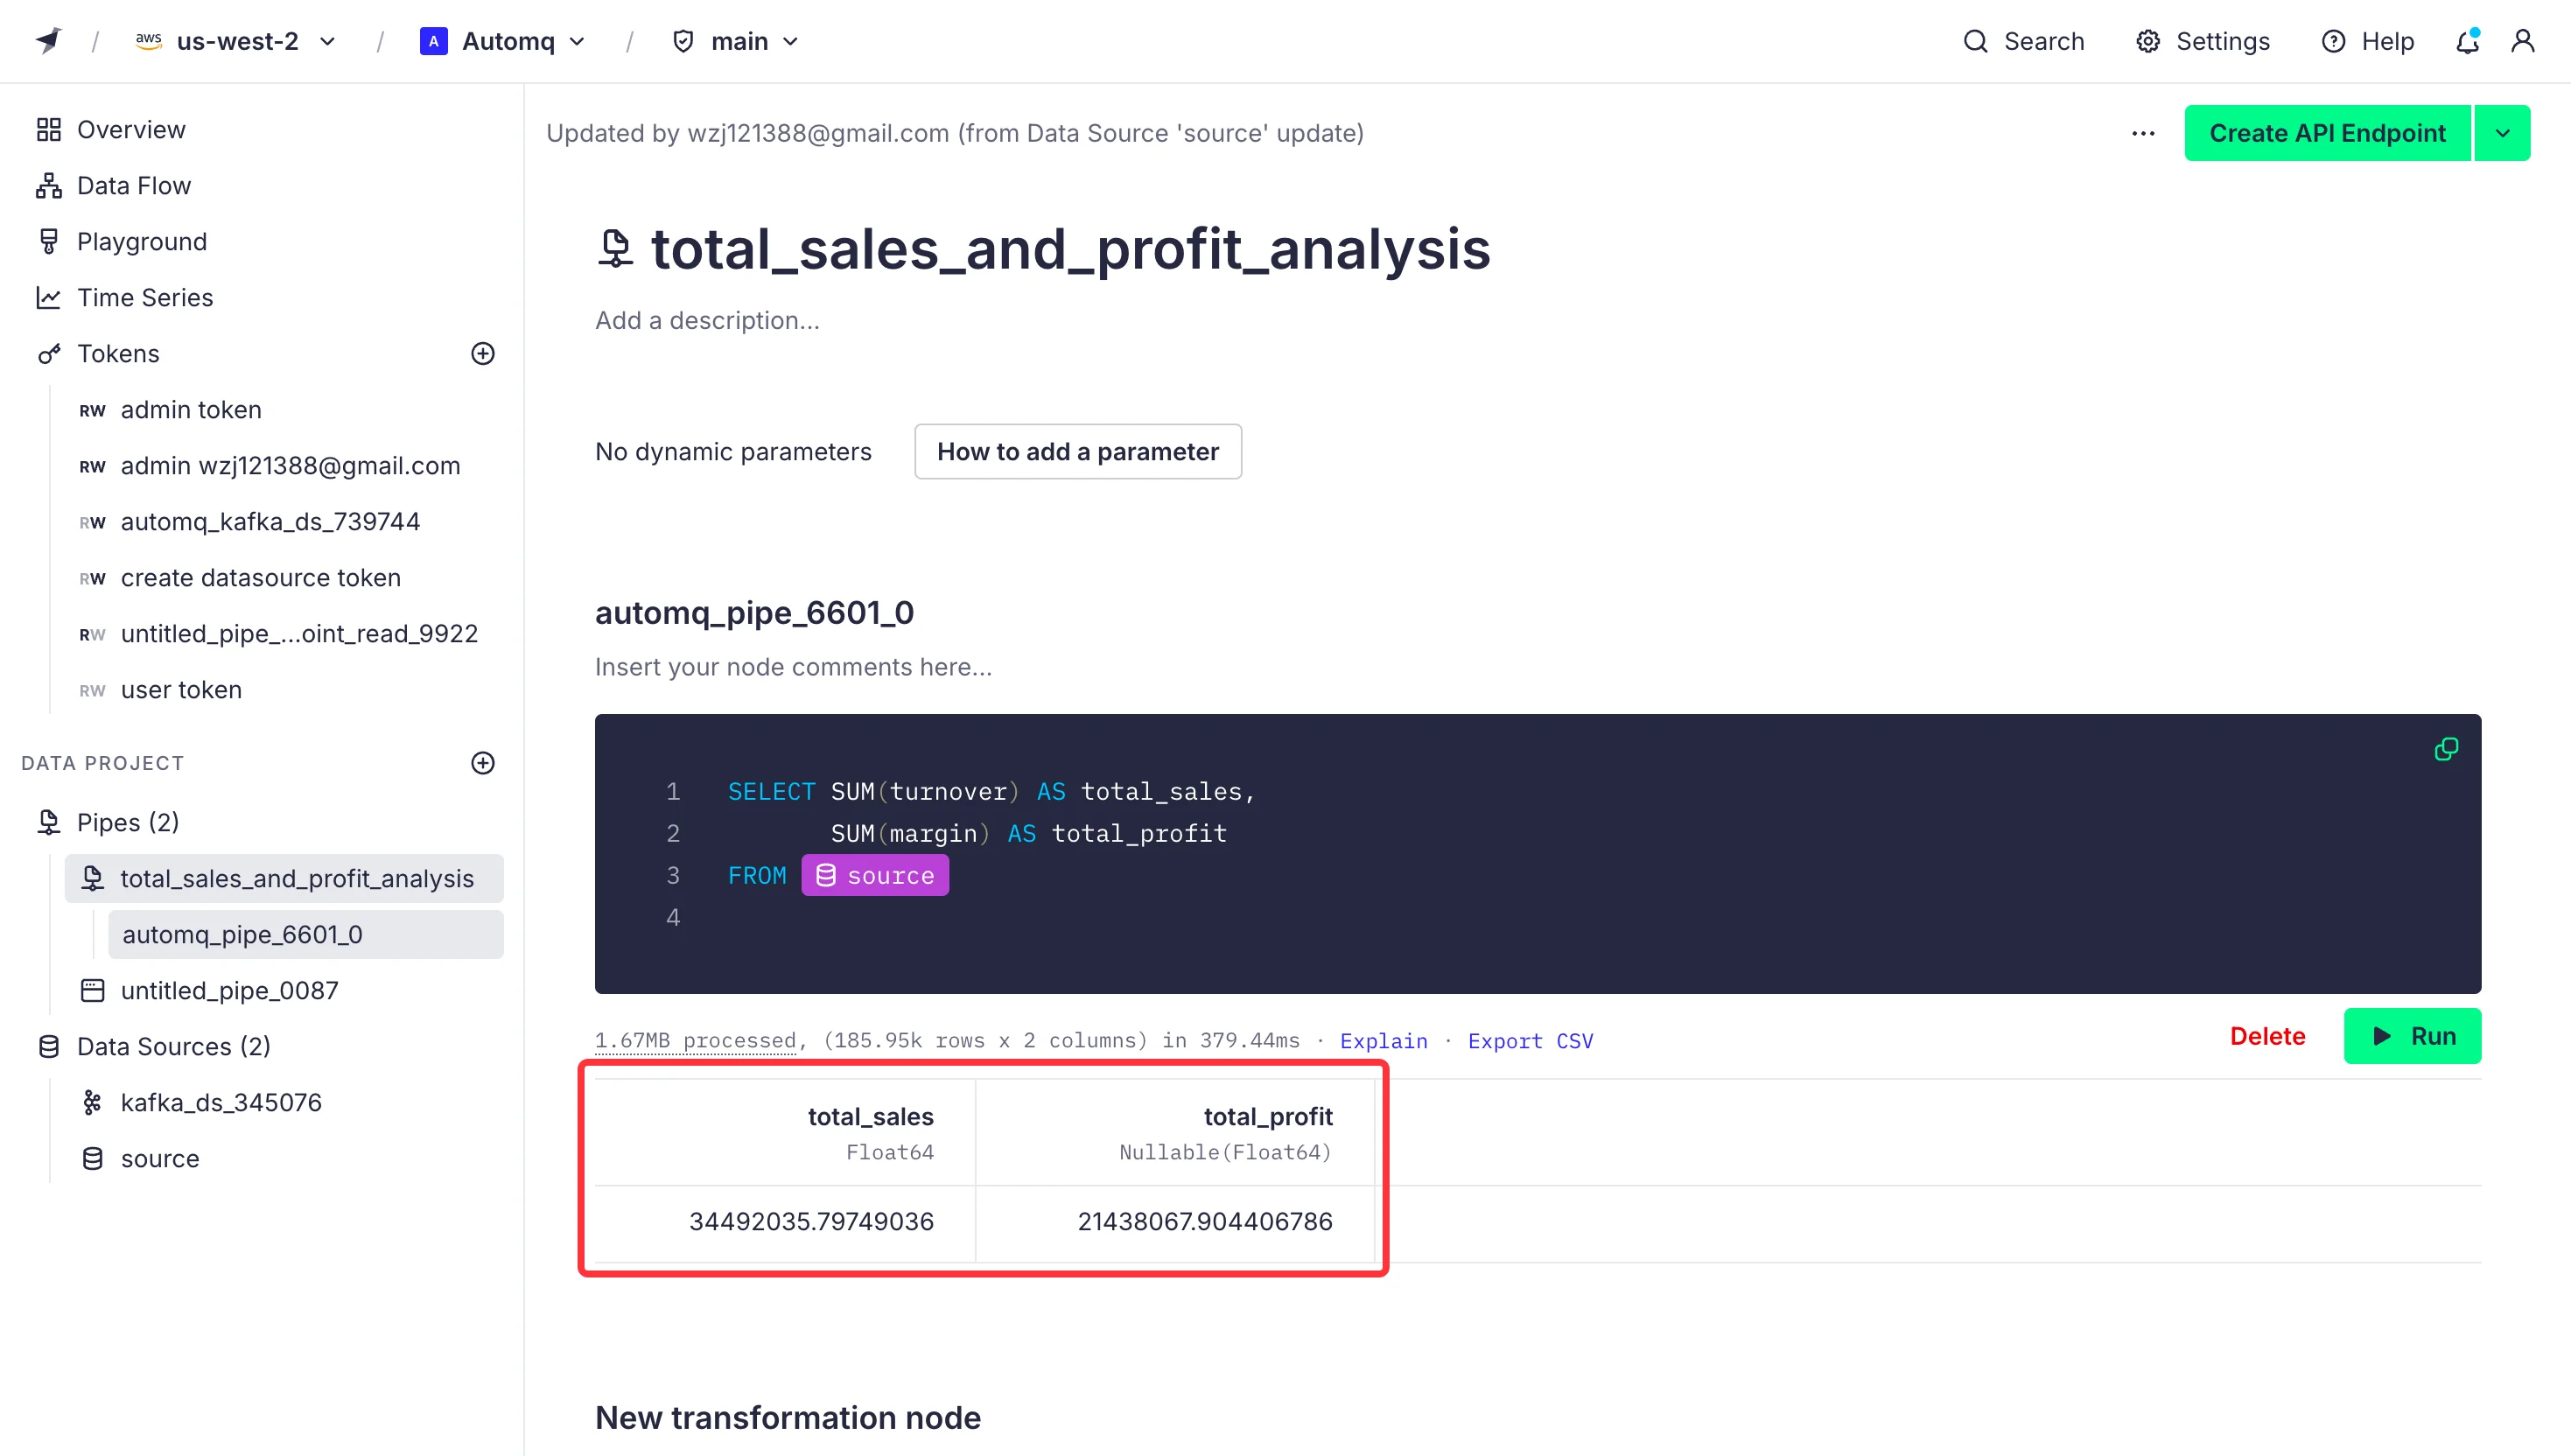
On the pipeline page, we can write SQL statements to filter and analyze the data. For example, if we want to analyze the total sales and profit from the imported order data, we can write the following code in the code block:
SELECT SUM(turnover) AS total_sales,
       SUM(margin) AS total_profit
FROM source
After running the code, the result is shown as follows:
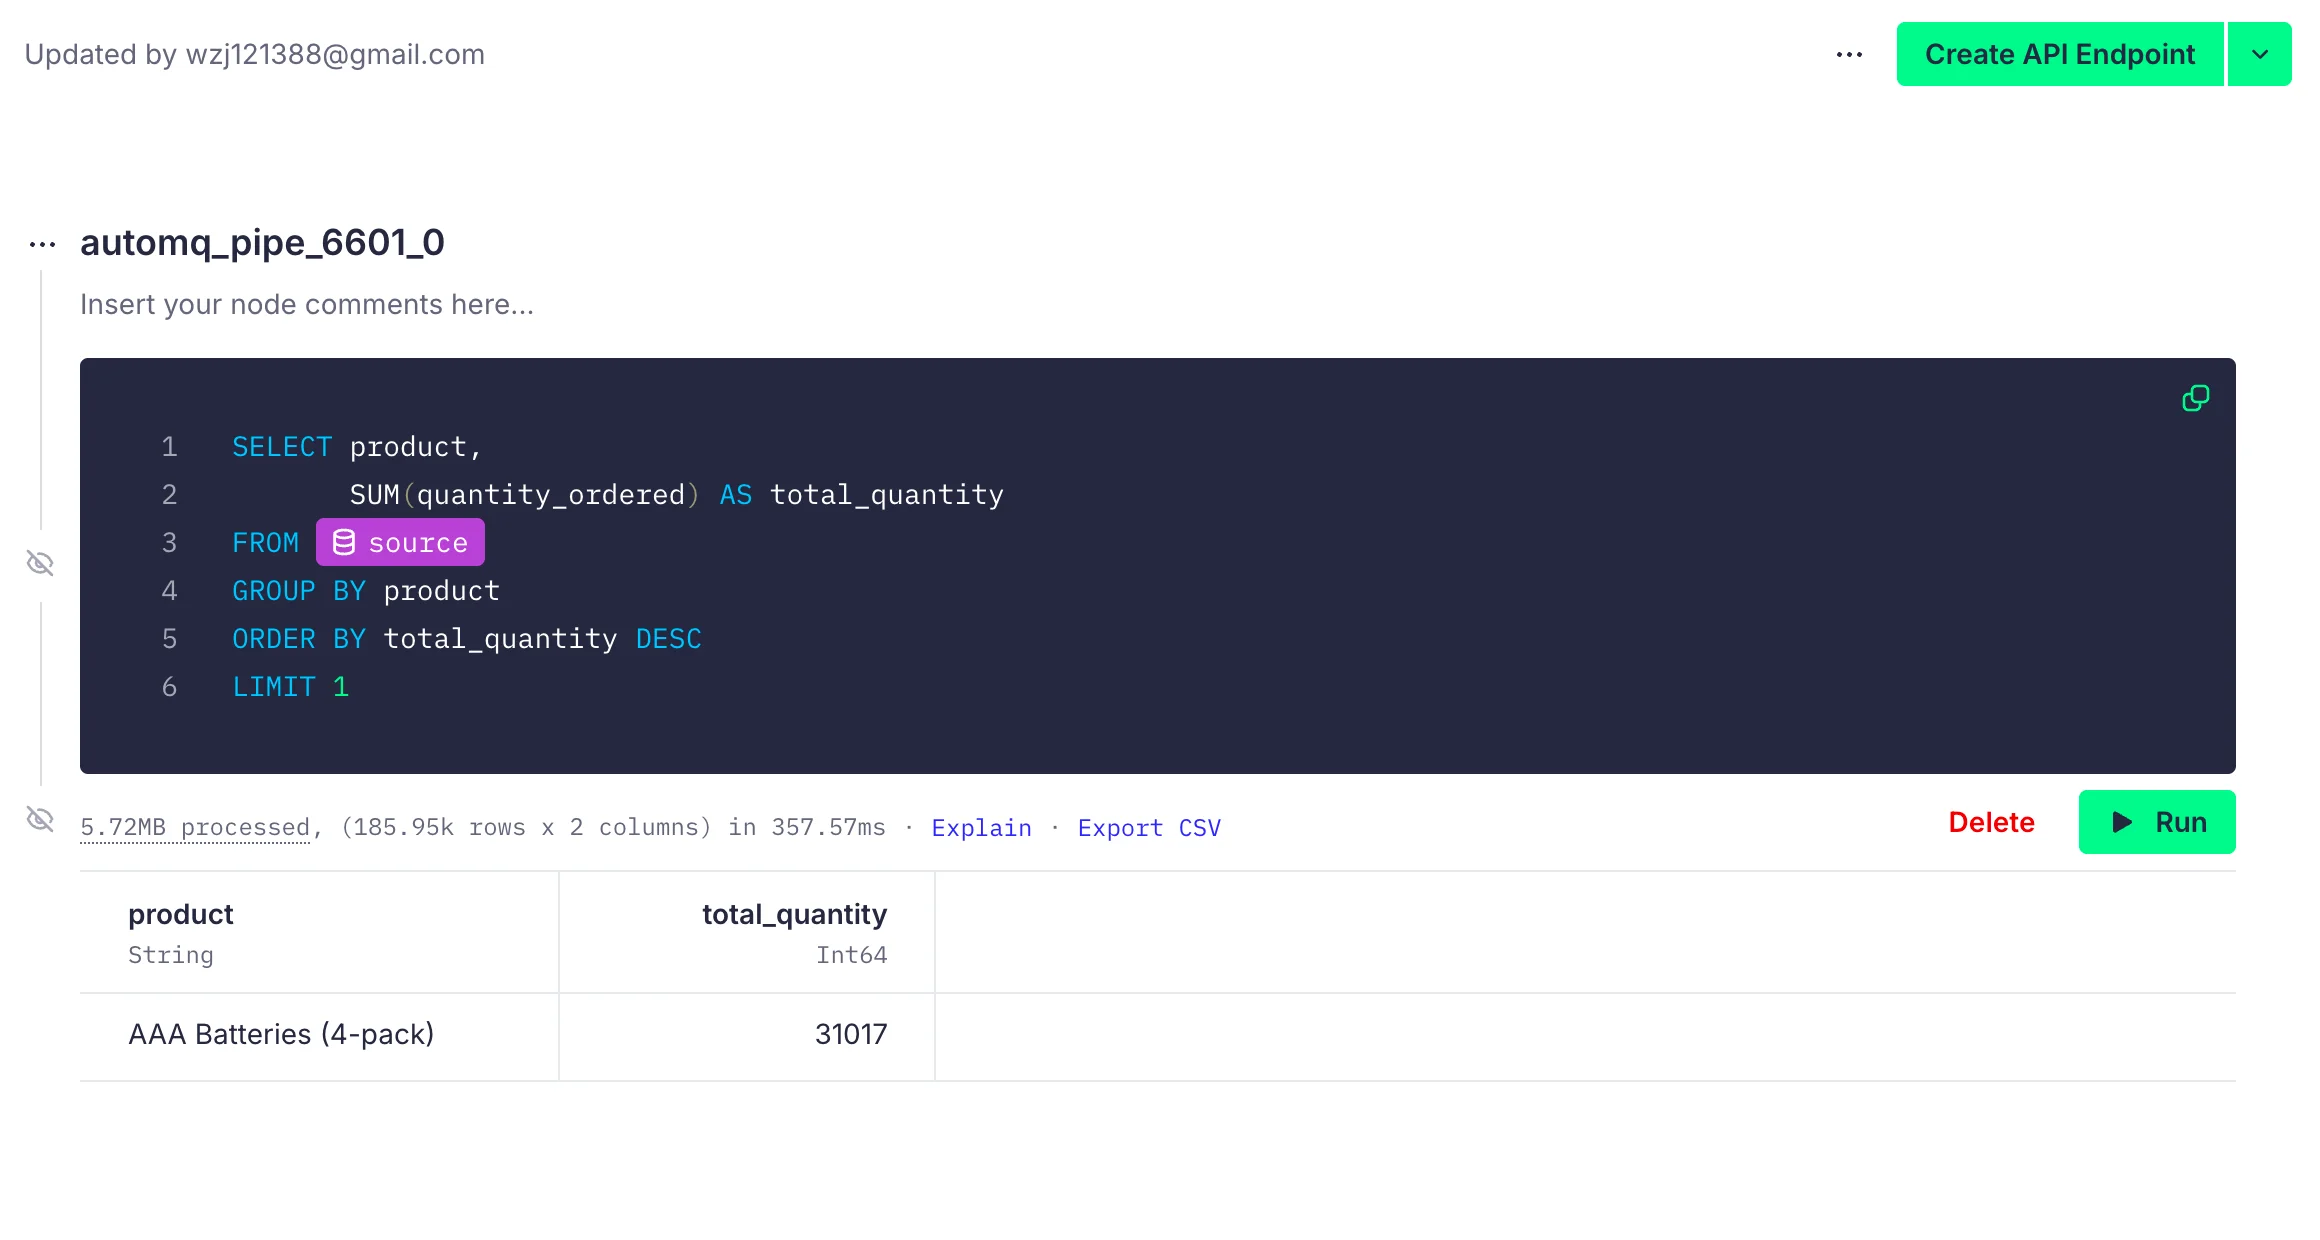
Tinybird also supports complex SQL queries. For instance, if we want to find out which product has the highest sales, we can write:
SELECT product,
       SUM(quantity_ordered) AS total_quantity
FROM orders
GROUP BY product
ORDER BY total_quantity DESC
LIMIT 1
After running the query, the results are as follows:
Now we have successfully connected AutoMQ with Tinybird and performed data analysis operations using Tinybird's SQL support.
Step 4: Data Visualization
Tinybird not only provides data APIs and supports integration with visualization platforms like Grafana, but it also allows for basic data visualizations. For details on how to visualize using other platforms, please refer to the [Tinybird documentation tutorial][9]. In this case, we will use Tinybird's built-in visualization tools for scenario analysis.
Scenario 1: Analysis of Top-Selling Products by Region
We aim to analyze sales data across different regions to identify the most popular products and categories in specific areas. This helps the company optimize inventory allocation in different regions, avoiding stockouts or overstock, ultimately improving customer satisfaction and sales revenue.
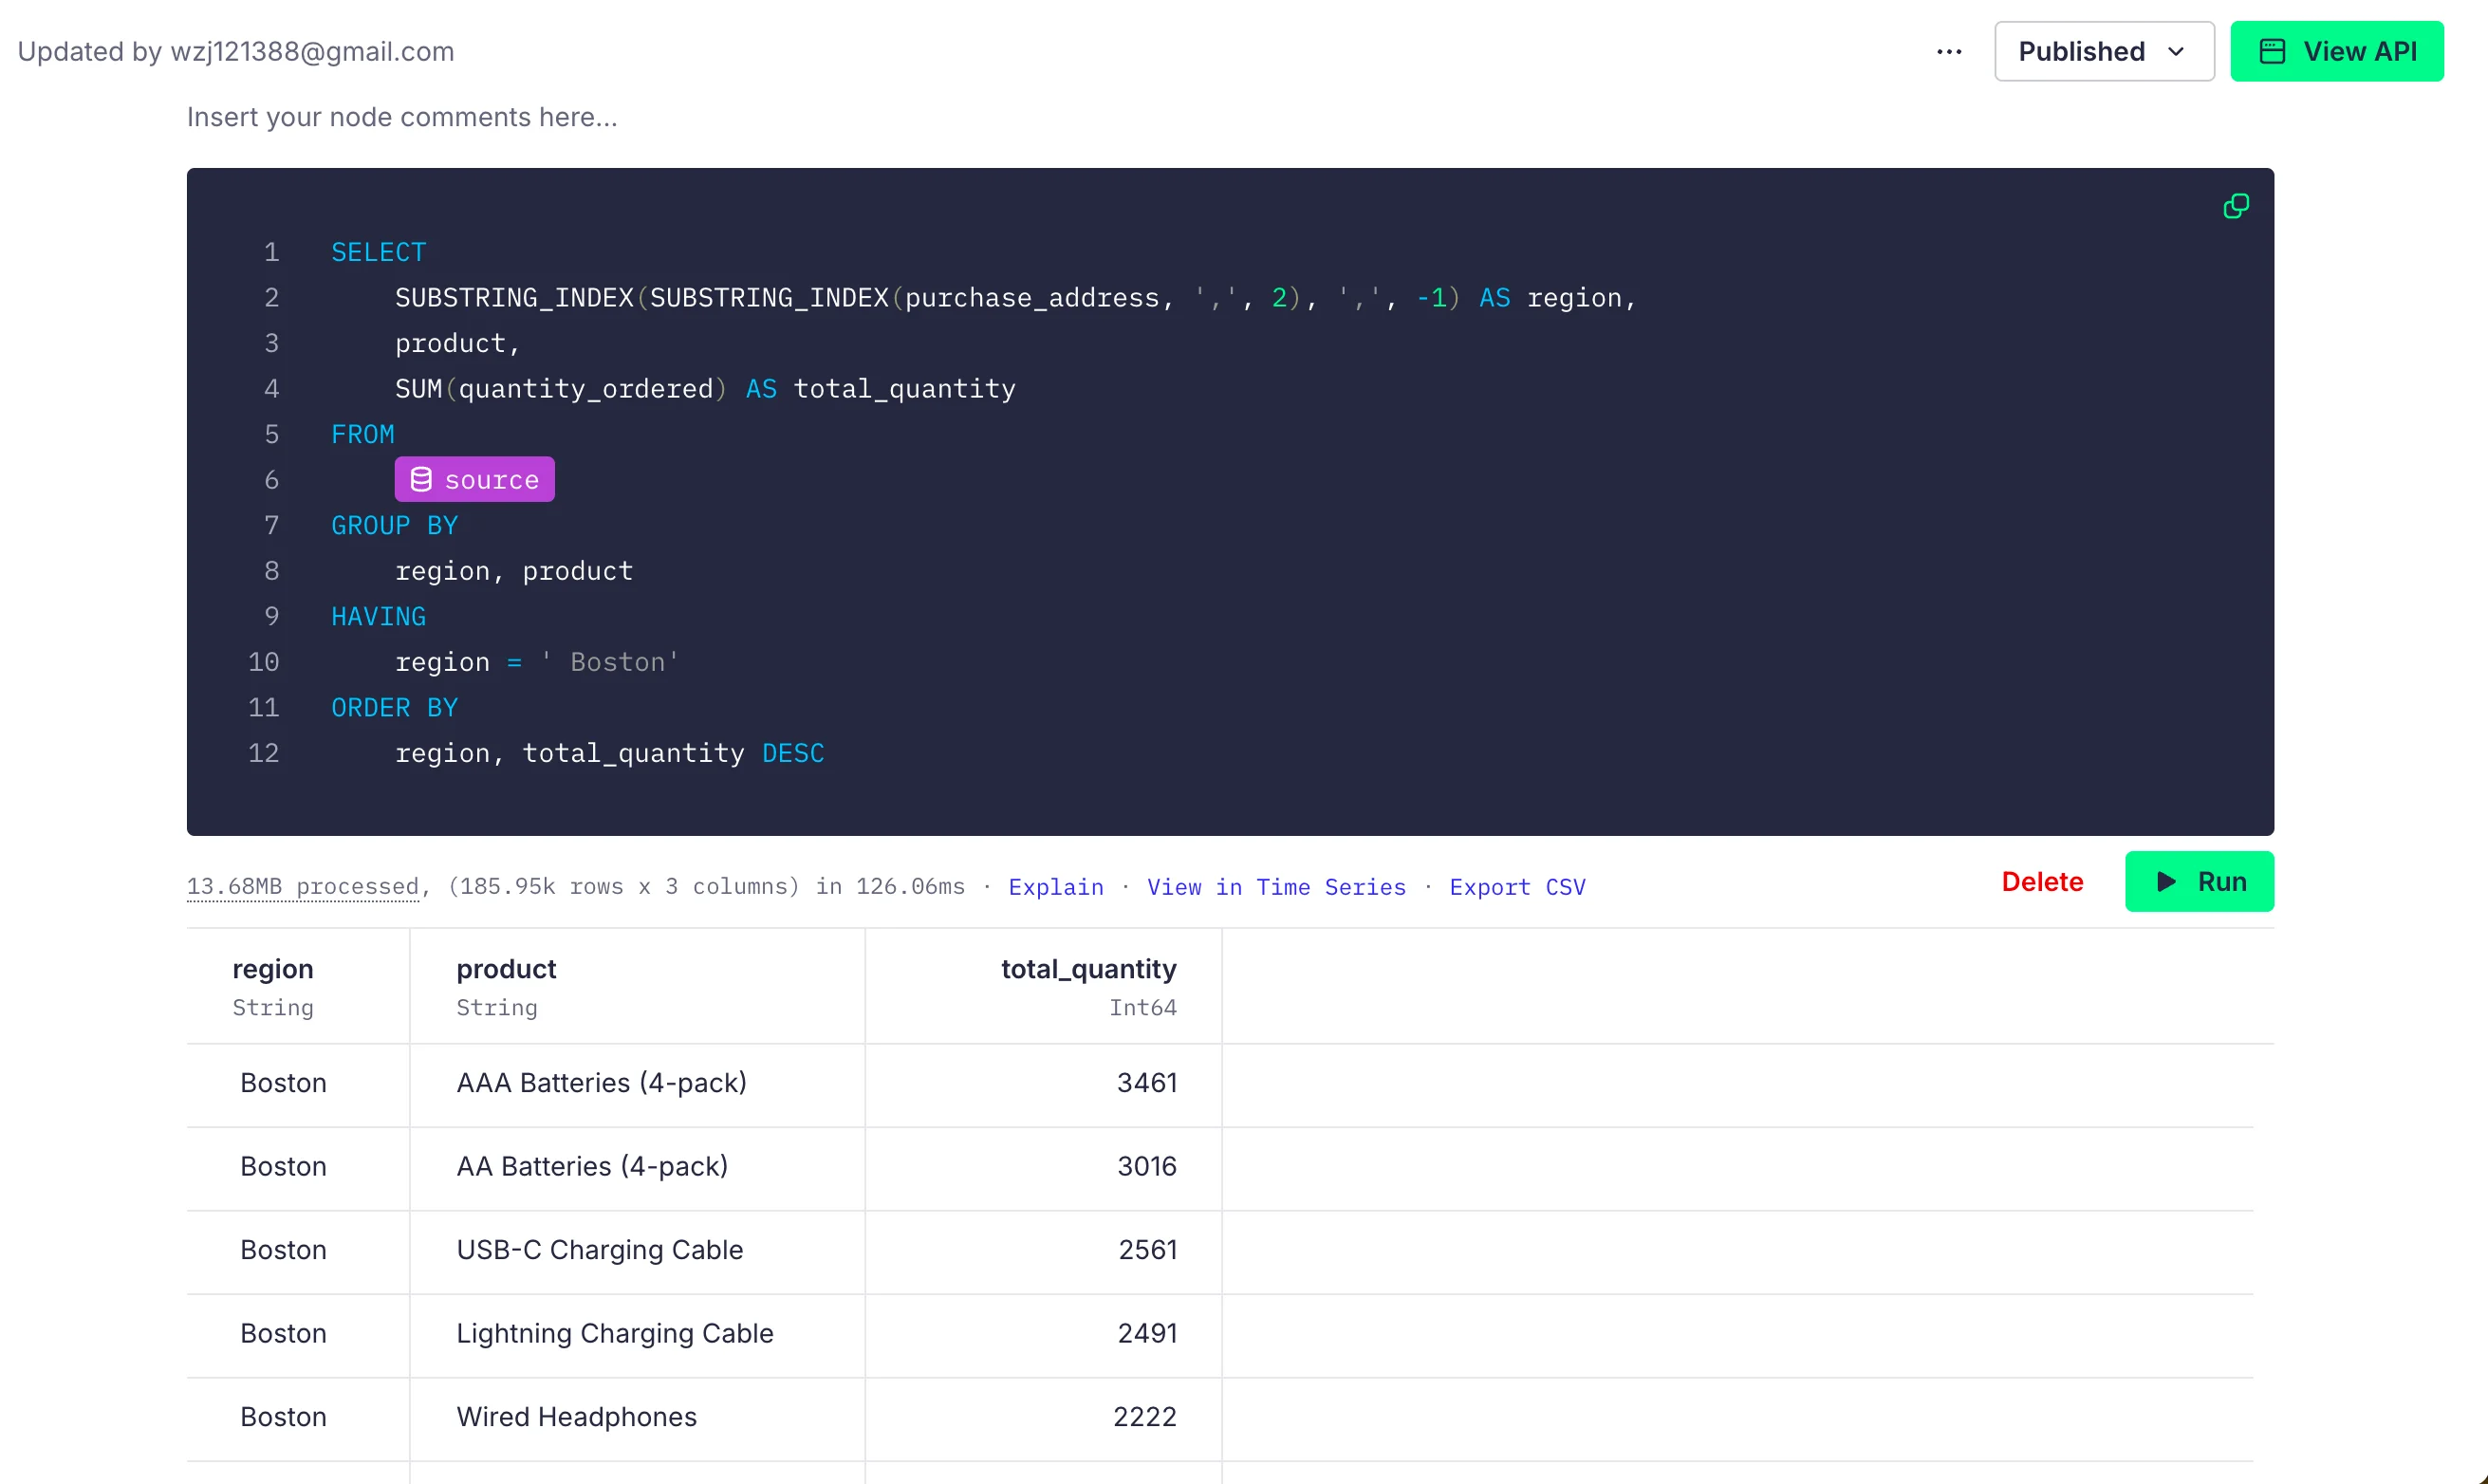
For instance, if we want to retrieve the sales data for the Boston area, we can write the following SQL:
SELECT
    SUBSTRING_INDEX(SUBSTRING_INDEX(purchase_address, ',', 2), ',', -1) AS region,
    product,
    SUM(quantity_ordered) AS total_quantity
FROM
    source
GROUP BY
    region, product
HAVING
    region = ' Boston'
ORDER BY
    region, total_quantity DESC
By running the query, we get the results as shown:
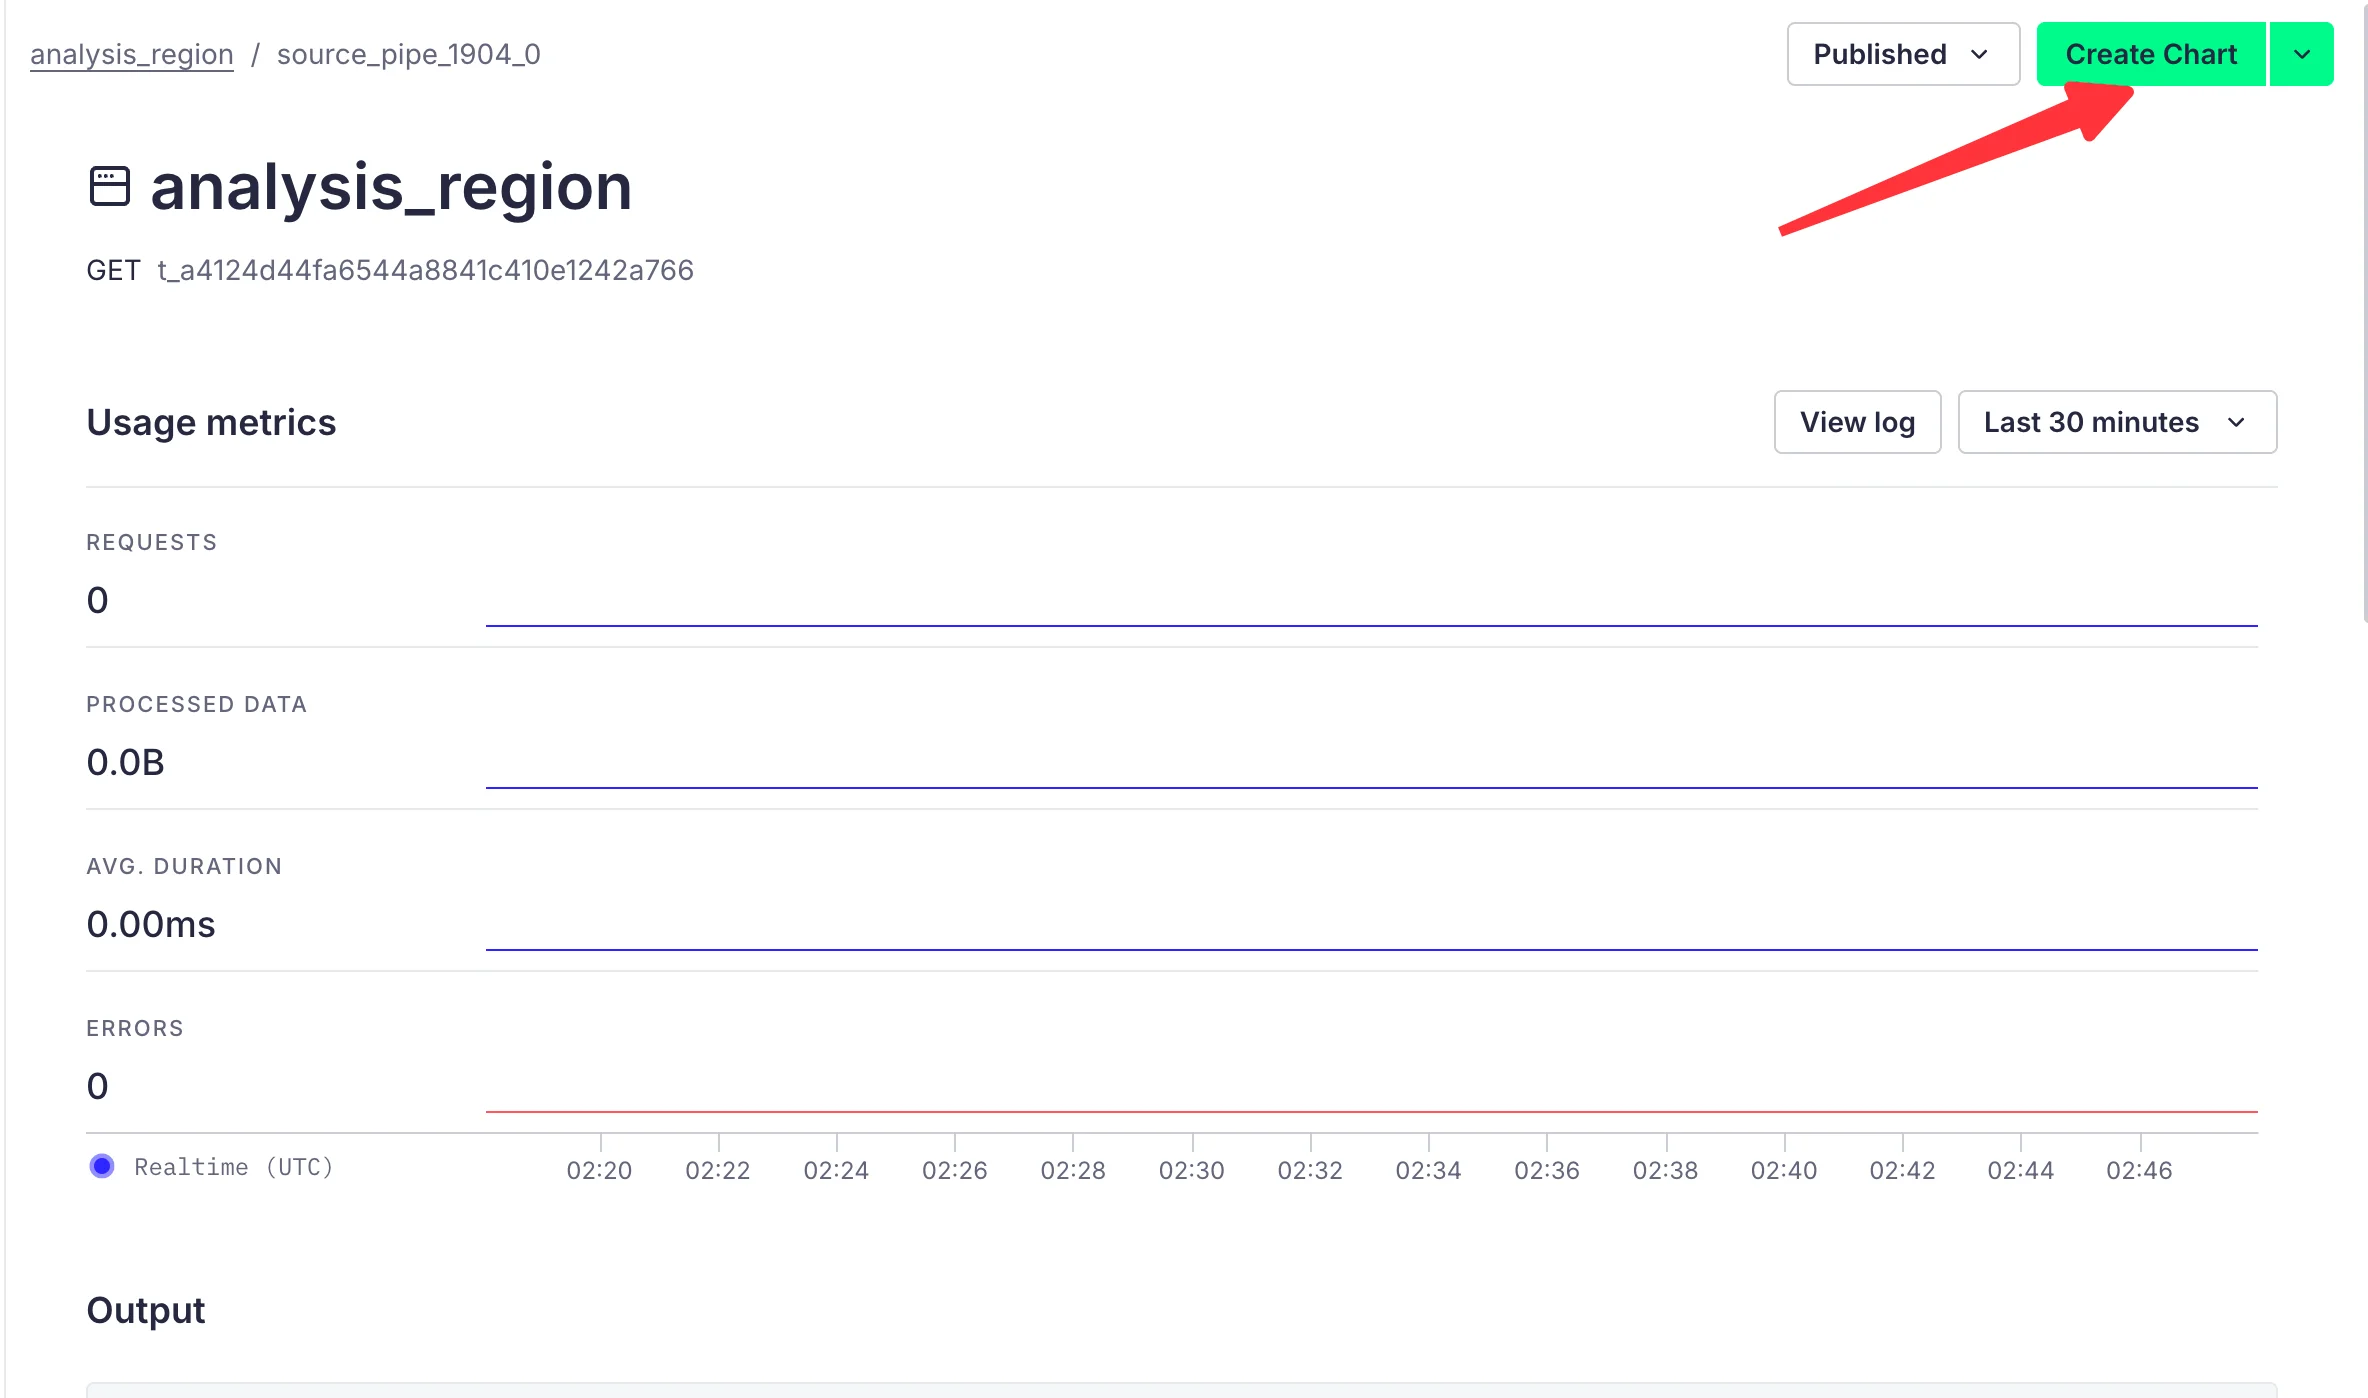
Click the "Create API Endpoint" button in the upper right corner and then click "Create Chart" to navigate to the chart creation page:
Here, we can choose the Bar List icon format and select products as subcategories to derive the visual result as follows:
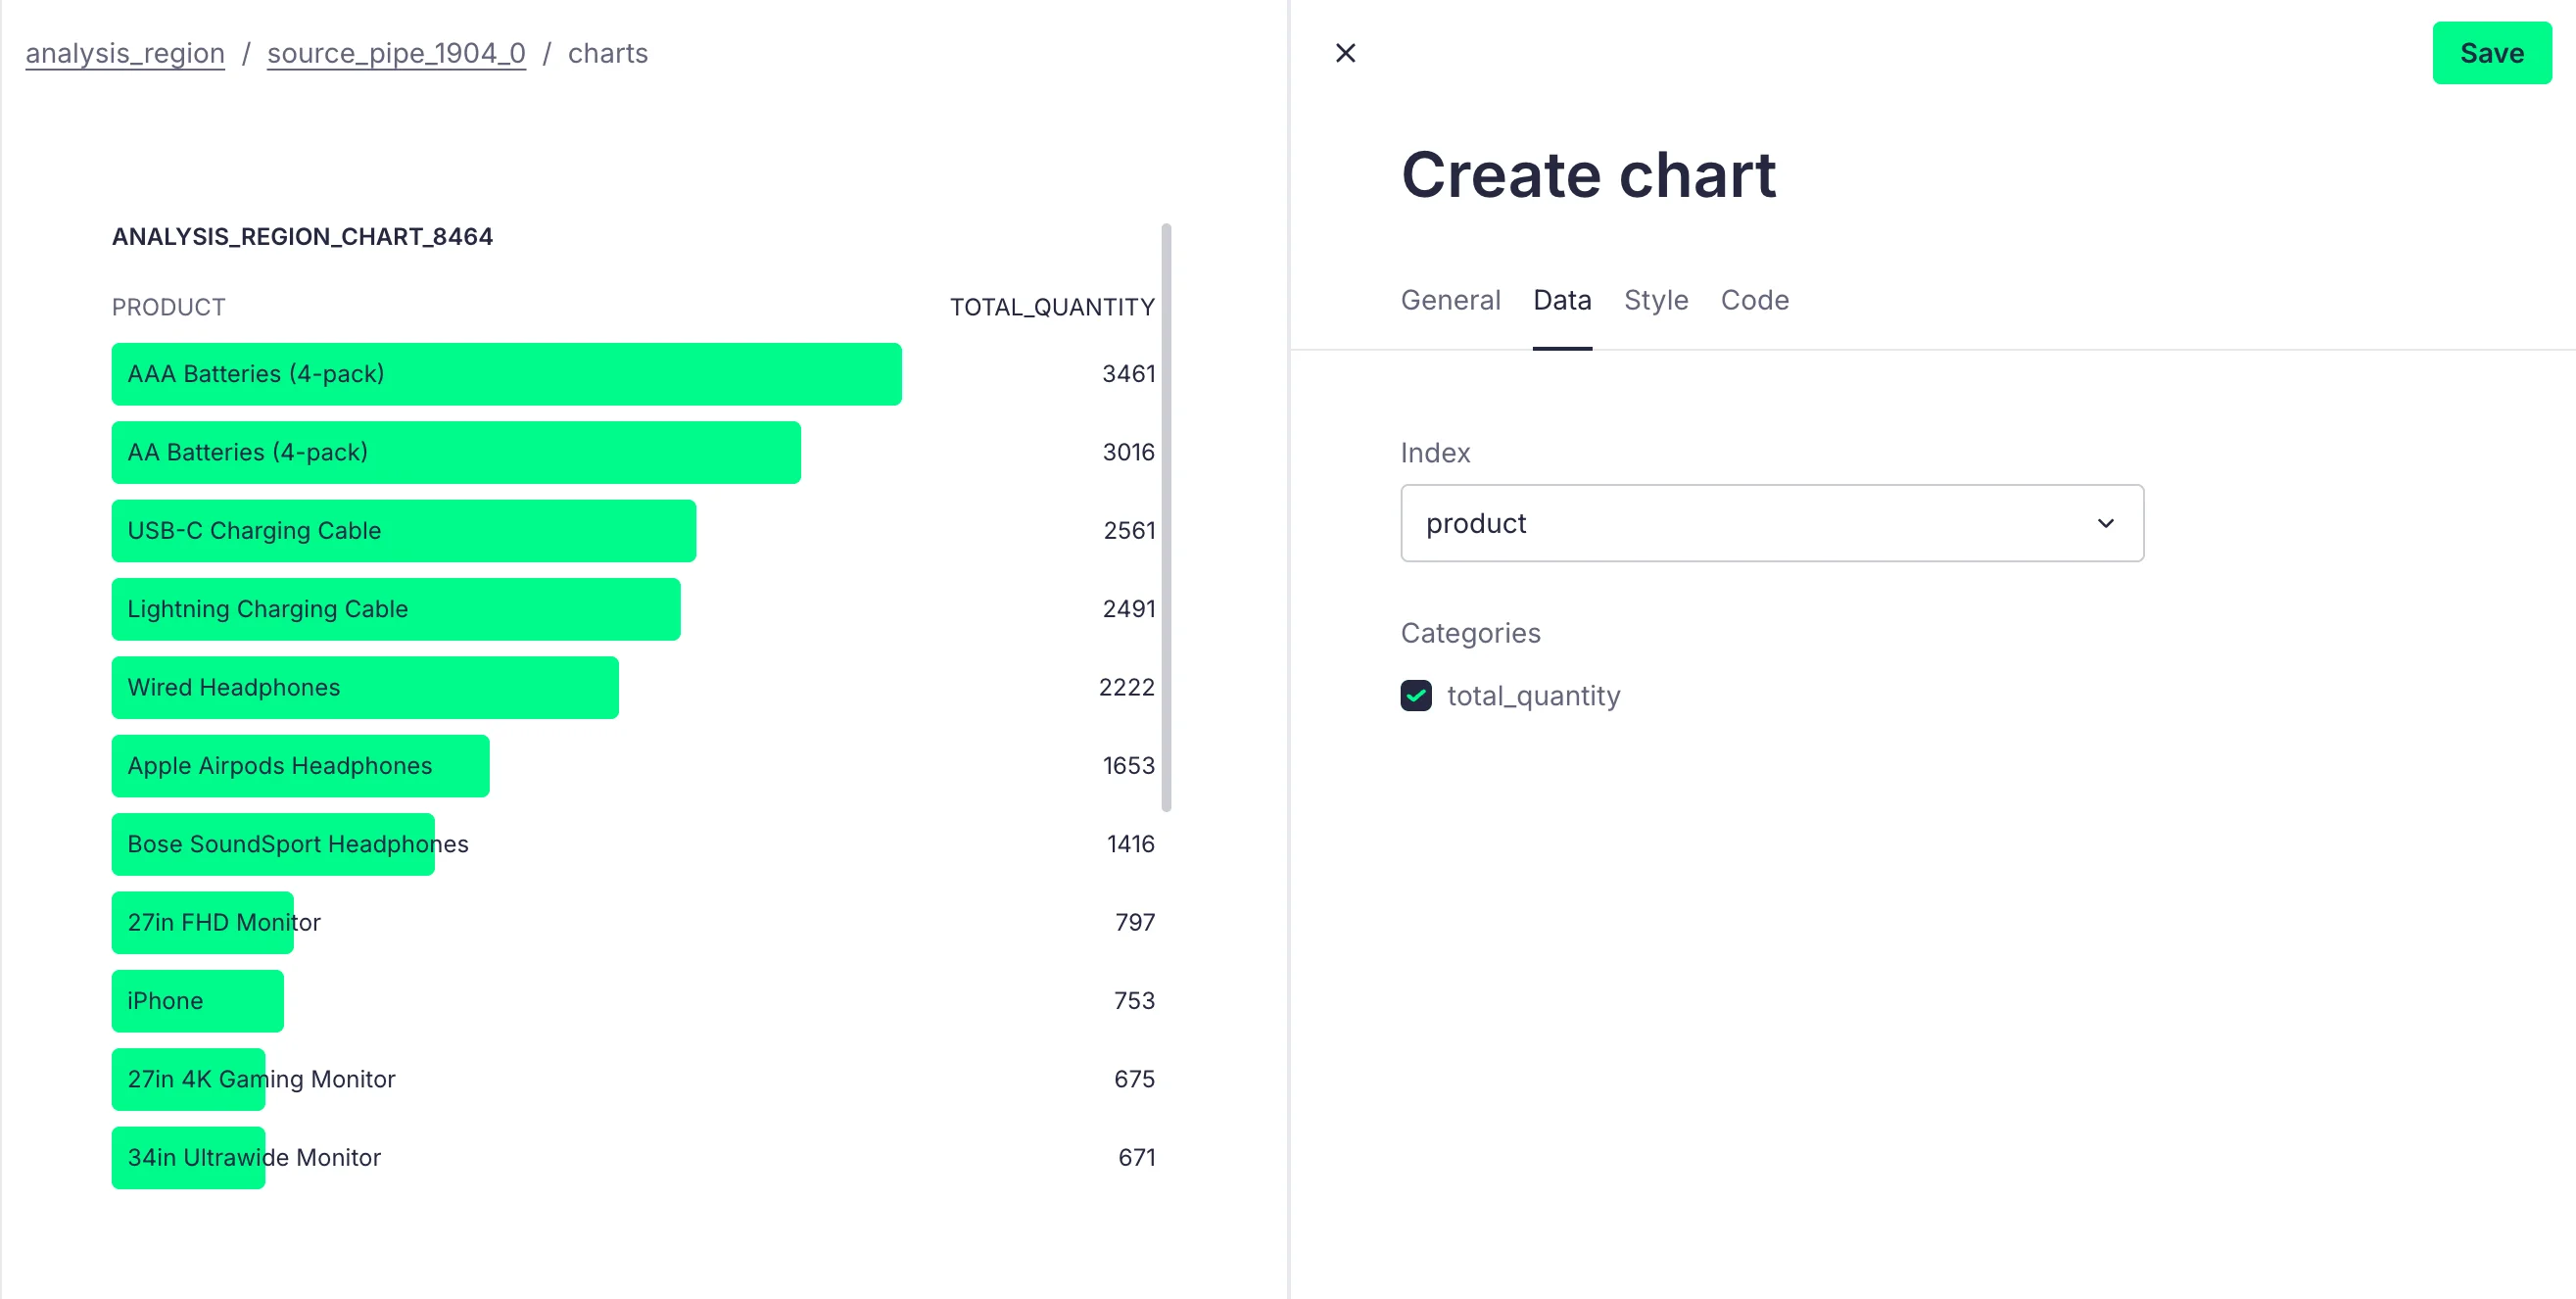
Now, we can devise a stock replenishment strategy for the Boston area to ensure sufficient inventory to meet high demand, or conduct targeted marketing activities for bestselling products, such as discounts or giveaways, to further boost sales.
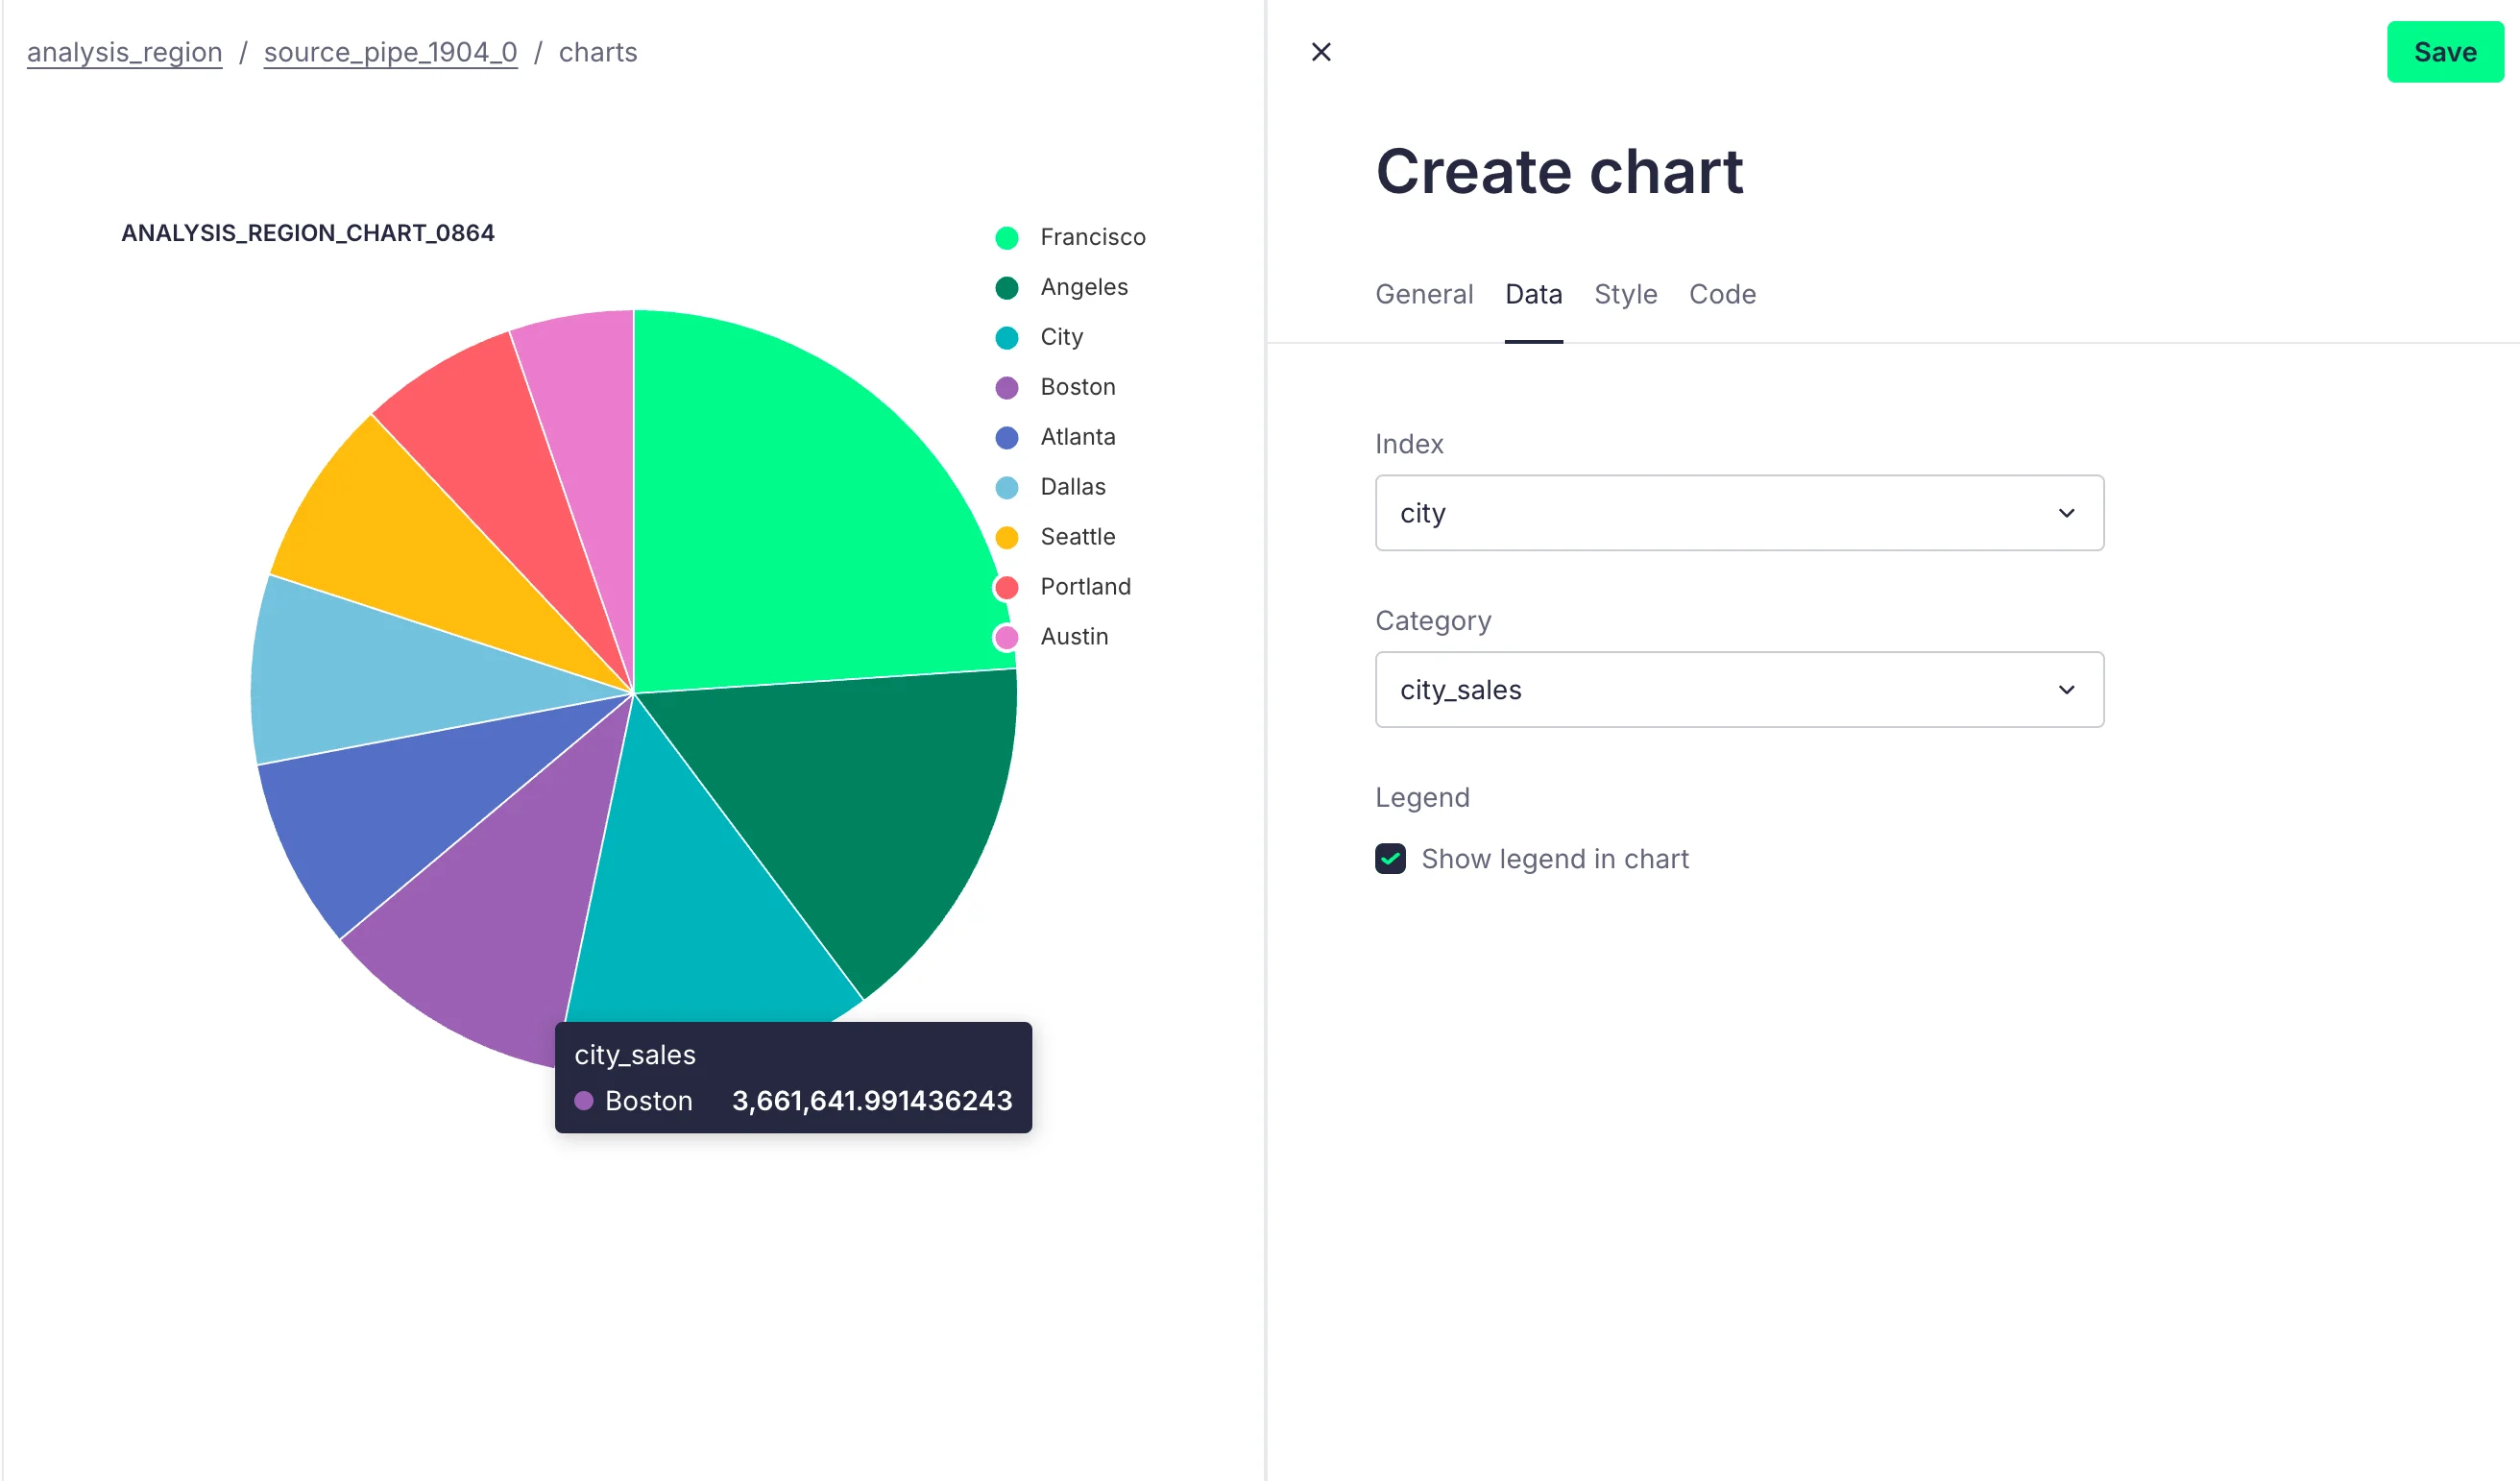
Scenario 2: Sales Distribution Analysis by Geographic Location
We aim to analyze sales performance across different geographic areas to identify key markets. Understanding which regions perform best can help businesses more clearly define their target markets and develop marketing strategies tailored to specific areas.
Based on the above requirements, we can write the following SQL:
SELECT SUBSTRING_INDEX(SUBSTRING_INDEX(purchase_address, ',', 2), ' ', -1) AS city,
       SUM(turnover) AS city_sales
FROM source
GROUP BY city
ORDER BY city_sales DESC
We can also obtain the following visual data:
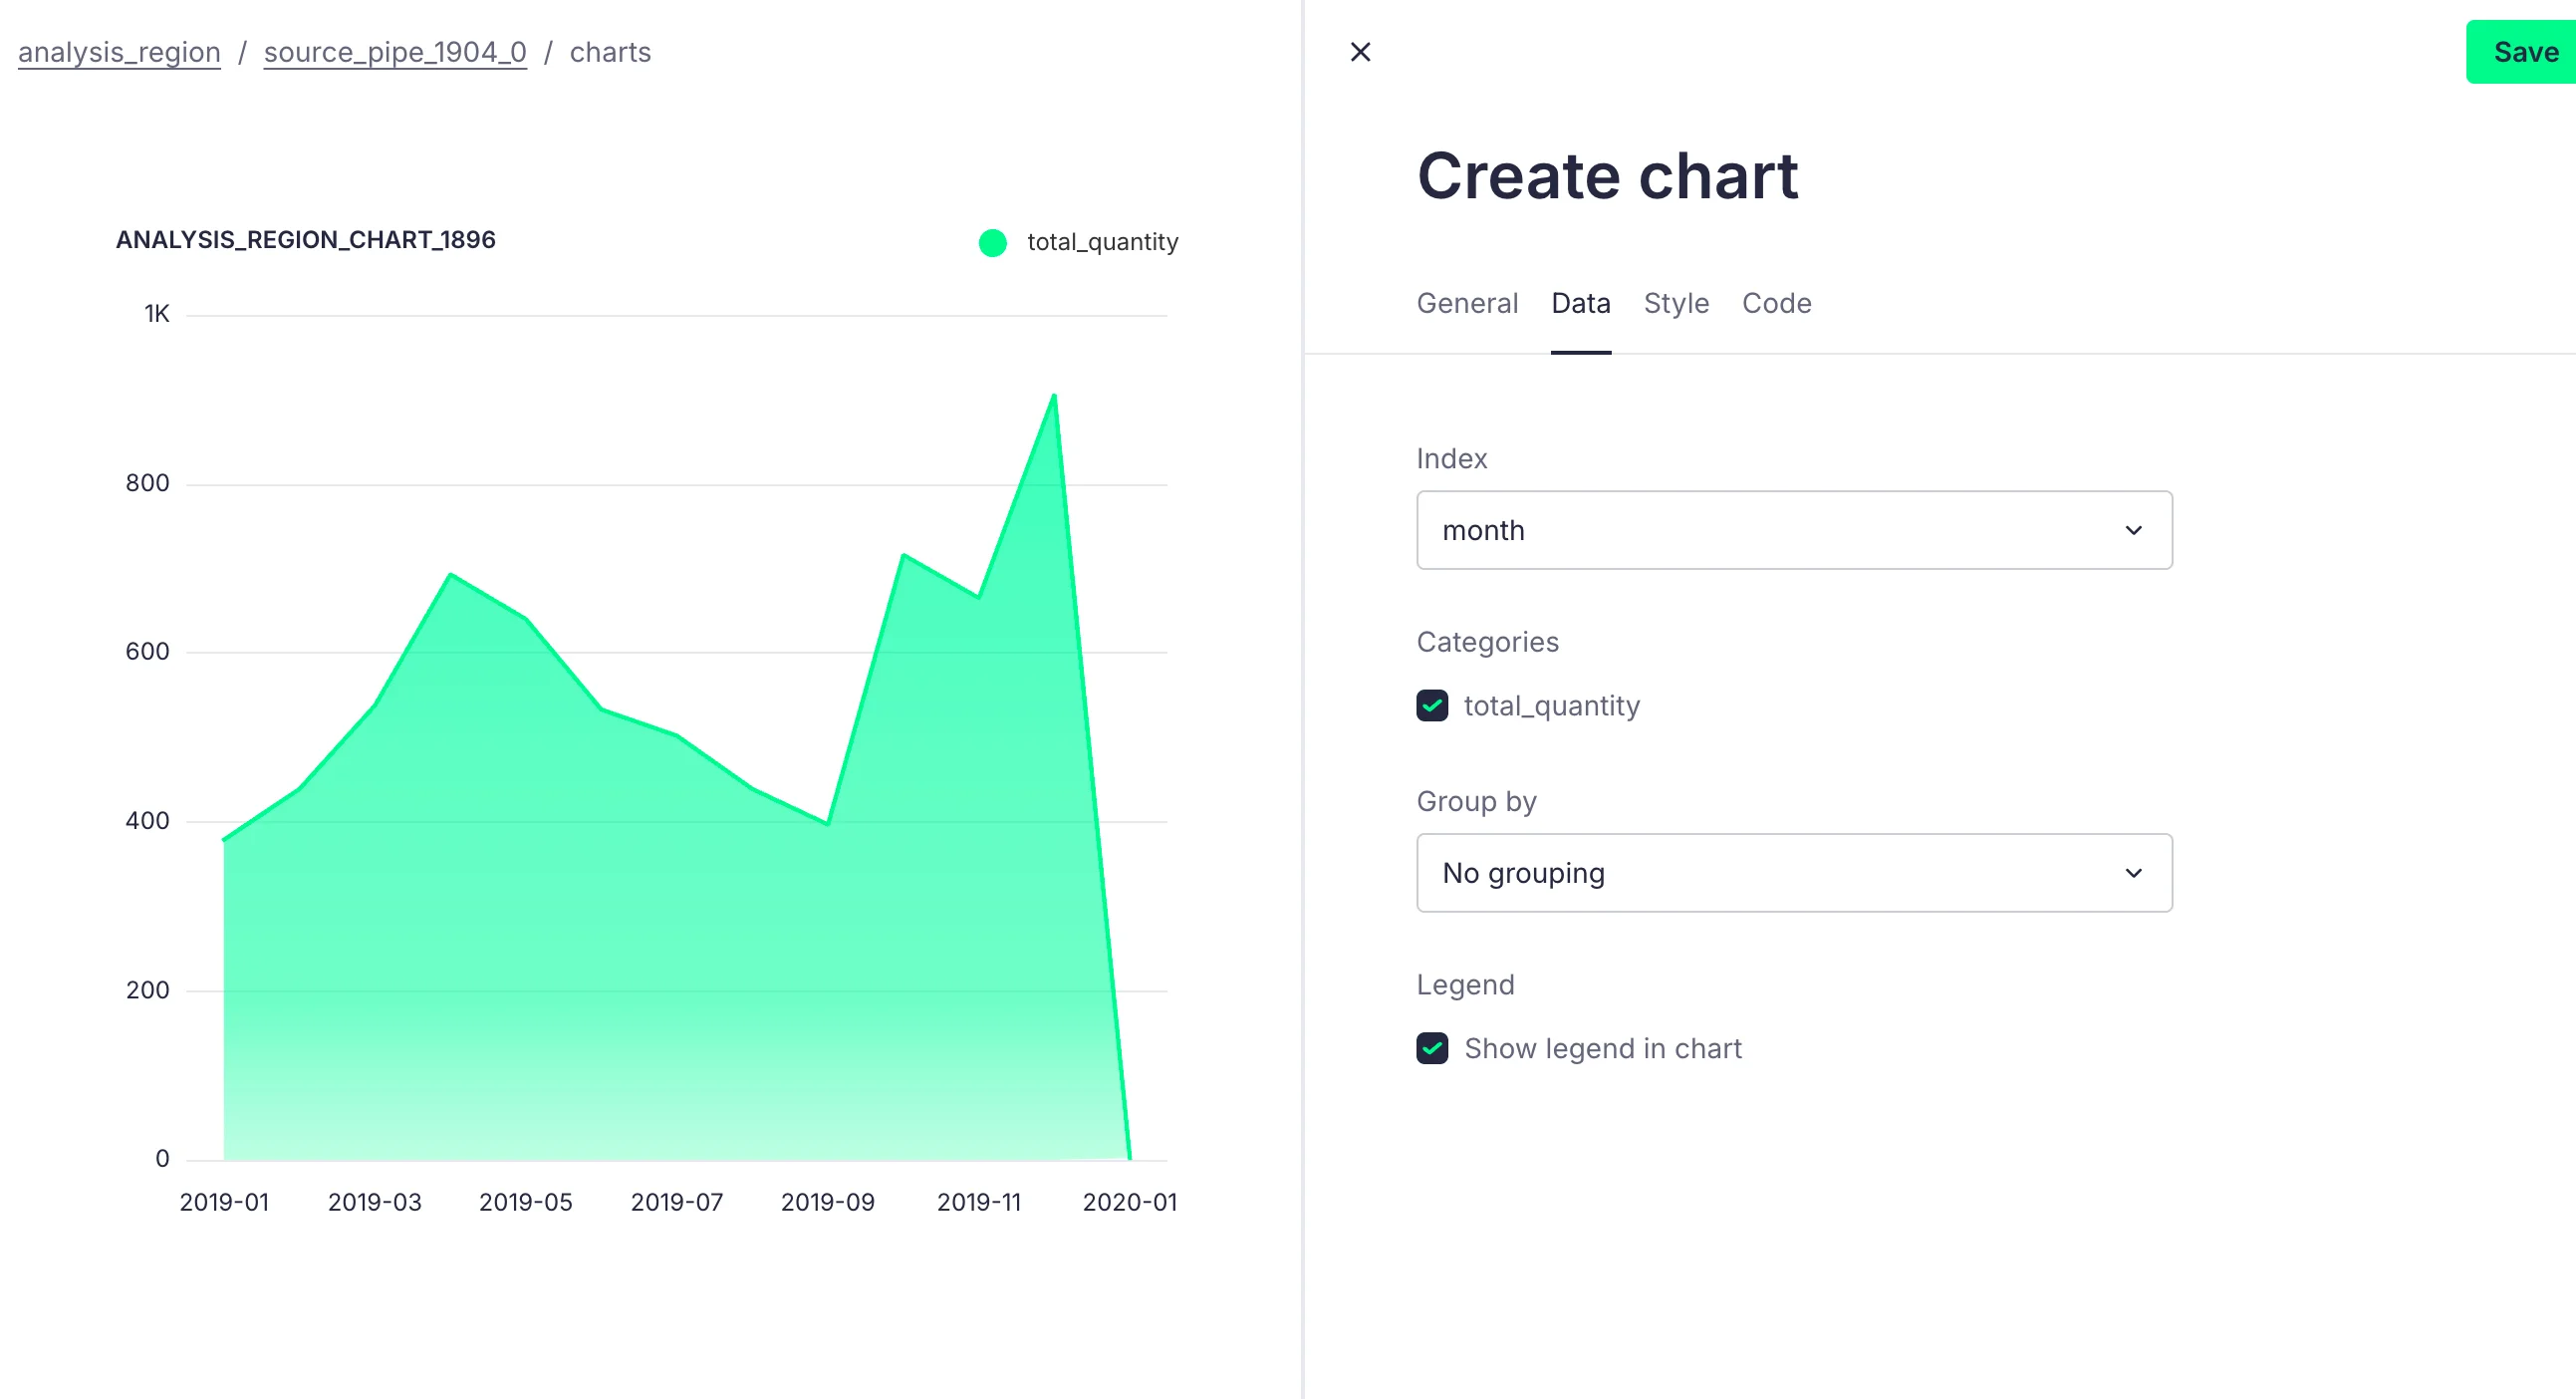
Scenario 3: Monthly Sales Analysis of a Product
We want to analyze the monthly sales of a particular product to identify seasonal sales peaks and troughs, which can help businesses develop marketing strategies for different seasons. Additionally, understanding the product's lifecycle in the market aids in planning appropriate inventory levels.
Here, we take the iPhone as an example and write the following SQL query based on our requirements:
SELECT
    DATE_FORMAT(order_date, '%Y-%m') AS month,
    SUM(quantity_ordered) AS total_quantity,
    SUM(turnover) AS total_sales
FROM
    source
WHERE
    product = 'iPhone'
GROUP BY
    month
ORDER BY
    month
Through GUI-Based Management, we can derive the following table:
Summary
This article provides a detailed guide on how to integrate AutoMQ with Tinybird for basic data analysis operations. The analysis examples presented are for demonstration purposes only. If your data points are ready and you have the necessary data, you can try learning and implementing more complex analysis and transformation logic from the official website. If you have any questions or need assistance, please feel free to contact us.
### References:
[1] Kafka: https://kafka.apache.org/
[2] AutoMQ: https://www.automq.com
[3] Tinybird: https://www.tinybird.co/
[4] Quick start Tinybird: https://www.tinybird.co/docs/quick-start
[5] Quick start AutoMQ: https://docs.automq.com/zh/automq/getting-started/cluster-deployment-on-linux
[6] AutoMQ SASL Security Authentication Configuration Guide: https://www.automq.com/zh/blog/automq-sasl-security-authentication-configuration-guide
[7] AutoMQ SSL Security Protocol Configuration Tutorial: https://www.automq.com/zh/blog/automq-ssl-security-protocol-configuration-tutorial
[8] Data Source: https://www.kaggle.com/datasets/vincentcornlius/sales-orders
[9] Consume API Endpoints in Grafana: https://www.tinybird.co/docs/guides/integrations/consume-api-endpoints-in-grafana


