
Table of Contents
Table of Contents
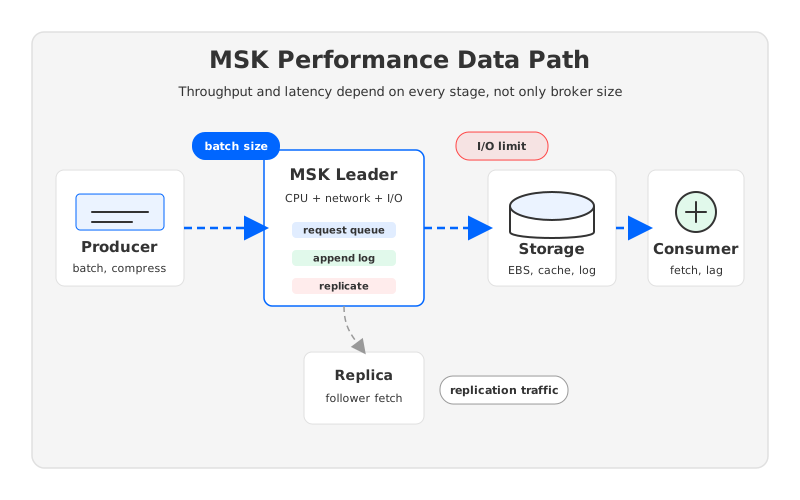
Amazon MSK performance problems rarely start as a single, clean failure mode. A team sees producer latency drift upward, consumer lag grow during peak hours, or broker CPU climb after a traffic increase. The first reaction is usually to ask whether the broker is too small. Sometimes it is. But Kafka performance on AWS is a full data path problem: producers batch records, brokers accept requests, leaders append to storage, followers replicate, consumers fetch, and operations move leadership or partitions when the cluster changes.
That is why tuning Amazon MSK throughput by changing one knob disappoints. A larger broker can expose a storage limit. More partitions can spread load but create more metadata, recovery, and reassignment work. Stronger durability settings add replication dependency. Long retention can turn local broker storage into the limiting resource. The practical question is not "How fast is MSK?" It is "Which part of the Kafka path is limiting this workload right now?"
1What Performance Means for Kafka on AWS
For architects and SREs, MSK performance should be measured with three lenses: write throughput, read throughput, and end-to-end latency. Write throughput is the rate at which producers publish records and receive acknowledgements. Read throughput is the rate at which consumers fetch without building lag. Latency includes producer request latency, broker queueing, replication delay, consumer fetch wait, and application processing time. Optimizing one can move pressure elsewhere.
AWS documentation makes this explicit in its best practices for Standard brokers: application availability and performance depend on both server-side and client settings, and AWS recommends performance testing to verify client configurations. The same guidance points teams toward right-sizing broker count, partition count, broker threads, CPU headroom, disk space, and partition reassignment behavior. MSK performance is not a single service quota; it is an operating envelope.
Apache Kafka's own design explains why. Kafka was built around append-only logs, batching, sequential I/O, page cache, and replication. The broker is fast when records move through large batches and consumers read data that remains warm in cache. It becomes less predictable with many small requests, hot partitions, cold reads, overloaded followers, or data movement during scaling. AWS adds broker instance type, EBS behavior for Standard brokers, network capacity, CloudWatch visibility, and managed rolling operations.
2The Throughput Path: Where Bottlenecks Actually Form
A Kafka write is not complete when a producer calls send(). The producer groups records by partition, compresses batches if configured, sends requests to partition leaders, waits according to acks, and handles retries within delivery timeouts. Kafka's producer configuration documentation describes batch.size, linger.ms, compression.type, buffer.memory, and delivery.timeout.ms as part of this path. These settings decide whether the broker receives efficient batches or a flood of tiny requests.
On the broker, throughput fans into several shared resources:
- CPU and request threads. AWS recommends keeping broker CPU, defined as
CPU User + CPU System, under 60% for operational headroom. AWS also notes that produce and consume latency can increase linearly with CPU utilization, which is the kind of warning that matters during rolling updates or broker replacement. - Network bandwidth. Producers, consumers, and replica followers all use broker network capacity. A broker that looks fine under producer-only testing can saturate when consumer fan-out or replication traffic is added.
- Storage I/O. Standard brokers use customer-managed storage choices such as EBS, tiered storage, provisioned storage throughput, auto scaling, and storage capacity alerts. If append or fetch I/O becomes the slowest stage, CPU scaling alone will not solve the problem.
- Partition leadership distribution. Partitions are the unit of parallelism, but traffic is not always evenly distributed. A small number of hot keys can pin leaders to a few brokers even when the cluster has many brokers.
AWS provides concrete signals for this diagnosis. For Standard brokers, AWS documents recommended partition counts by broker size, warns that high partition counts can affect CloudWatch and Prometheus metrics, recommends broker thread tuning for m5.4xl, m7g.4xl, and larger instances, and advises against heavy partition reassignment when CPU is already high because replication adds CPU and network load. The message is to identify the constrained resource before changing cluster shape.
3Storage Is Often the Hidden Limit
Kafka's original performance model assumes that sequential log appends are efficient and frequently read data can be served from page cache. That model is still powerful. The trouble appears when AWS operators treat broker storage as an infinite background detail. It is not. Local broker storage is where durability, retention, replication, recovery, and cold reads meet.
AWS recommends monitoring KafkaDataLogsDiskUsed and taking action when it reaches or exceeds 85%. Consuming messages does not remove them from the log, so retention policy controls how much data remains on broker storage. Long retention increases the working set. Large backfills can turn consumer reads into storage reads instead of cache reads. Broker restart after an unclean shutdown can also take longer when thousands of partitions require log recovery.
This storage pressure is not only about running out of bytes. It affects performance shape. A write-heavy workload with replication factor 3 places data on the leader and replicates to followers. A read-heavy workload with many consumer groups can reuse cached data near the head of the log, but historical reads may pull from disk or remote tiers. A scaling operation that reassigns partitions copies data between brokers and competes with production traffic. Storage is both a capacity concern and a latency concern.
The diagnostic mistake is to look at broker CPU first and stop there. iowait, request queueing, under-replicated partitions, follower lag, and consumer lag can tell a different story. When disk or replication is the narrow point, increasing producer concurrency can make the cluster look worse: producers create more in-flight work, brokers queue more requests, followers fall behind, and consumers see lag downstream of the write path rather than in the consumer application.
4Latency Is a Durability Tradeoff, Not Only a Speed Metric
Kafka latency is tied to the durability choices that make Kafka useful in the first place. In the Kafka replication design, each partition has one leader and followers. Followers pull from the leader and stay in the in-sync replica set when they keep up. Producers choose acknowledgement behavior with acks, while topics can use min.insync.replicas to require a minimum number of in-sync replicas for acknowledged writes. Kafka documents this as a consistency and availability tradeoff: stronger durability can reduce availability when replicas fall out of sync.
For MSK teams, that means low latency should not be pursued by weakening durability without a deliberate risk decision. acks=all plus an appropriate min.insync.replicas is common for important production data, but it makes write latency sensitive to replica health and network conditions. If a follower slows down, the leader's commit path can feel the effect. If ISR shrinks below the configured threshold, writes can fail rather than silently accepting weaker durability.
Producer and consumer batching add a second tradeoff. Kafka's producer docs describe linger.ms as a way to wait briefly for more records so the client can send larger batches; the default changed to 5 ms in Kafka 4.0 because larger batches can improve efficiency and may still deliver similar or lower latency under load. Consumer fetch.min.bytes works in the other direction: larger fetch minimums can improve server throughput at the cost of additional latency. These knobs do not remove broker-side limits. They change how pressure arrives.
5Scaling Performance Without Endless Rebalancing
Scaling a Kafka cluster is partly a capacity operation and partly a data movement operation. Adding brokers creates capacity, but existing partitions do not automatically become balanced enough to eliminate hot spots. Adding partitions can increase write parallelism for non-keyed or appropriately keyed workloads, but it can also change ordering assumptions and increase per-partition overhead. Reassigning existing partitions moves data, which is why AWS notes that replication during reassignment can significantly increase cluster load at first.
The right scaling path depends on what the workload is allowed to change. If ordering is required by key, adding partitions may not help a hot key. If most traffic lands on a few topics, adding brokers without moving leadership may not help immediately. If CPU is near the headroom threshold, a large reassignment can compete with the traffic it should relieve. If storage is close to full, retention or storage expansion may be more urgent than broker count.
This is where a performance test should look like a production rehearsal rather than a synthetic producer benchmark. Include producer compression and batching, consumer fan-out, cross-AZ replication, expected retention, failure or rolling-update headroom, and the operational action you plan to use when the cluster grows. A benchmark that measures only fresh writes to an empty cluster leaves the harder question unanswered.
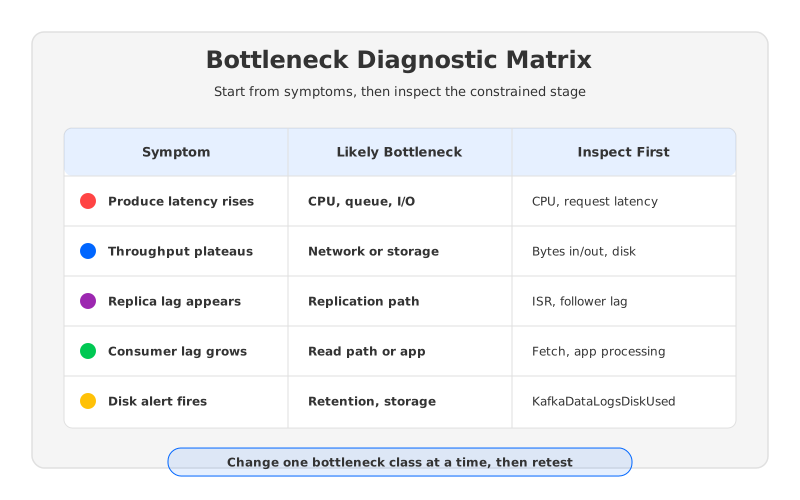
| Symptom | Likely bottleneck | What to inspect first |
|---|---|---|
| Producer latency rises with CPU | Broker request processing | CPU User + System, request queueing, network and I/O threads |
| Consumer lag grows during backfills | Read path or storage | Fetch latency, page cache hit behavior, disk read pressure, consumer fetch settings |
| Under-replicated partitions appear | Replication path | Follower lag, broker network, disk write latency, ISR changes |
| Scaling adds load before relief | Data movement | Partition reassignment volume, CPU headroom, network traffic |
| Disk alerts or recovery risk | Storage capacity and retention | KafkaDataLogsDiskUsed, retention settings, topic growth, partition count |
6How AutoMQ Changes the Bottleneck Discussion
After the MSK path is decomposed, an architectural pattern becomes visible: traditional Kafka brokers combine compute, local log storage, replication, and cache behavior in the same scaling unit. That coupling is manageable for many workloads, but it becomes awkward when the team wants elastic compute, long retention, and predictable scaling together. A broker is not only a CPU and network endpoint; it also owns durable storage.
AutoMQ approaches this problem as a Kafka-compatible streaming system with shared storage and stateless brokers. Its architecture documentation says AutoMQ replaces Kafka's native log storage with S3Stream, uses object storage as the primary repository, introduces a WAL layer because object storage has high latency and low IOPS characteristics, and makes brokers stateless. That design changes the bottleneck map: long-term durability and retention move toward shared object storage, while WAL and cache paths make writes and reads practical for streaming workloads.
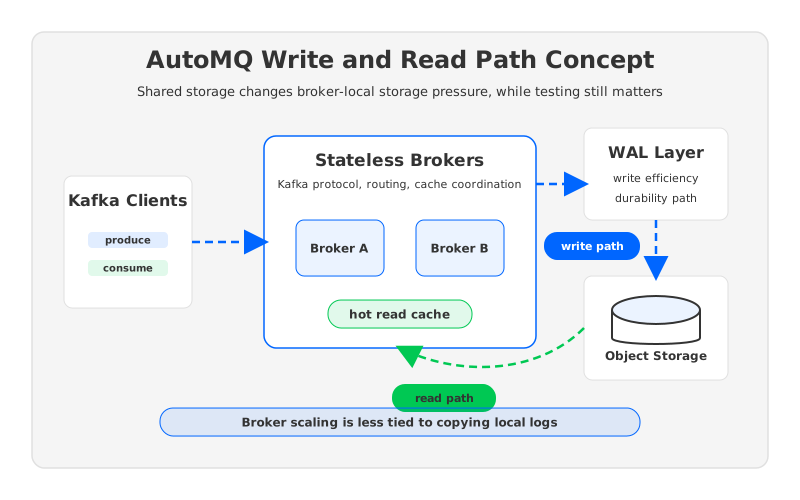
Shared storage does not make performance problems disappear. It changes which problems are coupled. Stateless brokers can make scaling and partition reassignment less dependent on copying local broker logs. Object storage can reduce the pressure to size every broker for long retention. A WAL layer can absorb write-path requirements before data is persisted to object storage. Cache still matters for hot reads, and network still matters for producer, consumer, and storage traffic. Workload testing still matters because message size, key distribution, fan-out, durability settings, and region placement can dominate the outcome.
That is the sober way to evaluate AutoMQ next to Amazon MSK. If the current MSK cluster is constrained by poor producer batching or a single hot partition, a new storage architecture will not fix the application-level distribution problem. If broker storage, reassignment, and retention keep forcing capacity decisions, a shared-storage Kafka architecture is worth testing. Compare with the same workload: topics, keys, retention, producer acknowledgements, consumer fan-out, and failure scenarios.
7Practical MSK Performance Checklist
Start with the data path, not the instance catalog. Map producer settings, topic partitioning, broker resources, replication health, storage capacity, and consumer fetch behavior. Then change one bottleneck class at a time. For MSK Standard brokers, keep AWS's CPU headroom guidance in view, watch disk usage before it becomes urgent, and avoid large partition reassignments when the cluster is already overloaded. For clients, review batching, compression, fetch sizing, retry behavior, and connection strings across Availability Zones.
The deeper lesson is that "MSK throughput" is not a single number. It is the result of a chain. The slowest link may be broker CPU this quarter, storage next quarter, and consumer fan-out after a product team adds another downstream application. If storage ownership and scaling friction are part of the pain, include shared-storage systems such as AutoMQ in the test. Start with the AutoMQ architecture documentation and run a workload-specific proof of concept rather than relying on generic benchmark claims.
8FAQ
8.1What is the most common Amazon MSK performance bottleneck?
There is no universal bottleneck. CPU, broker network, storage I/O, replication, partition distribution, producer batching, and consumer fetch behavior can all limit throughput or latency. For production MSK clusters, storage and replication are often under-investigated because teams start with broker size and CPU dashboards.
8.2How do I improve MSK throughput without risking stability?
Measure first, then tune the constrained part of the path. Review producer batching and compression, partition leadership distribution, broker CPU headroom, network throughput, disk usage, and consumer lag. AWS recommends keeping broker CPU under 60% for operational headroom and warns that partition reassignment adds CPU and network load, so avoid large data movement as the first response to an overloaded cluster.
8.3Do more partitions always improve MSK performance?
No. More partitions can increase parallelism when traffic is evenly distributed and application ordering constraints allow it. They also add metadata, recovery, monitoring, and reassignment overhead. AWS publishes recommended partition counts per Standard broker size and recommends testing when using higher counts, especially for high-partition, low-throughput workloads.
8.4Why does storage affect Kafka latency?
Kafka writes to an append-only log and replicates data for durability. Storage affects append latency, follower catch-up, log recovery, retention, and historical reads. When consumers read data that is no longer warm in cache, or when partition reassignment copies data between brokers, storage can become visible as higher latency or lag.
8.5Is AutoMQ a replacement for MSK performance tuning?
No. AutoMQ changes the architecture by using shared storage, a WAL layer, cache, and stateless brokers, but it still needs workload testing. It is most relevant when MSK pain comes from broker-local storage coupling, long retention, elastic scaling, or heavy data movement. Client batching, key distribution, network placement, and consumer design still matter.
9References
- AWS, Best practices for Standard brokers - Amazon MSK
- AWS, Amazon MSK broker types
- AWS, Monitor an Amazon MSK Provisioned cluster
- AWS Big Data Blog, Best practices for right-sizing your Apache Kafka clusters to optimize performance and cost
- Apache Kafka, Producer Configs
- Apache Kafka, Consumer and Share Consumer Configs
- Apache Kafka, Design: Replication
- AutoMQ Docs, Architecture Overview


