
Table of Contents
Table of Contents
At 2:13 a.m., a lag alert says a consumer group is falling behind. The tempting response is to add consumers, raise a limit, or restart the group. Those actions can be correct, but the alert itself does not tell you which one is safe. Consumer lag is an observation about unfinished work. It is not a diagnosis of the component creating that work.
The same rising line can come from a producer burst, a consumer that has become slower, or a group that is spending its time rebalancing instead of processing records. Each case has a different limiting factor and a different fix. Start by tracing the rate difference that creates the backlog, then decide whether the bottleneck belongs to the producer path, the consumer path, or group coordination.
1The alarm reports the difference, not the cause
For a partition, lag is the distance between records available at the log end and the consumer group's progress. Depending on the tool and metric, that progress may be represented by a committed offset, a current position, or records successfully processed by the application. Those are related measurements, but they are not interchangeable. A consumer can fetch records quickly and commit slowly, or commit offsets while downstream work is still being acknowledged elsewhere.
That distinction matters during an incident. A group-level number can rise while only one partition is overloaded. A lag number can remain high while the group is draining backlog at a healthy rate. A dashboard can show no lag metric during a group transition, even though a rebalance is the reason processing paused. Amazon MSK's documentation, for example, notes that its consumer-lag metrics depend on consumer-group state and are emitted for stable or empty groups. Missing data is therefore another signal to interpret, not proof that lag disappeared.
The first question is not “How do we reduce Kafka consumer lag?” It is “What changed in the amount of work arriving, the rate of work completing, or the time available for the group to make progress?” That wording keeps the investigation tied to observable behavior instead of to a favorite remediation.
2Lag is a rate difference over time
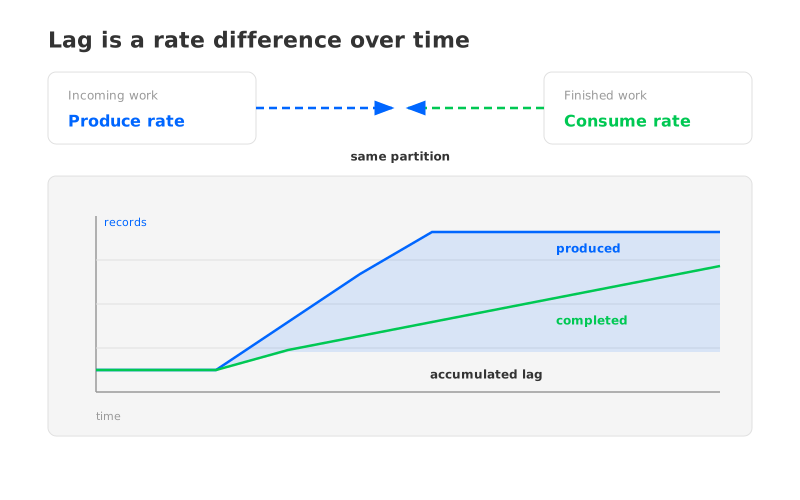
For one partition over a short interval, a useful operating model is:
backlog change ≈ records produced - records completed
The backlog accumulates when the incoming rate stays above the completion rate. A short producer burst can create a large offset gap even when the consumer is healthy. Conversely, a modest but sustained drop in consumer throughput can produce the same alert. The graph looks similar; the evidence around it does not.
Measure both sides of the path before changing capacity. On the producer side, compare records-in and bytes-in with the time lag began. Check whether a batch job, retry storm, partition-key change, or new producer deployment altered the traffic shape. On the consumer side, compare records-consumed rate with handler duration, poll interval, commit latency, retry volume, and downstream dependency latency. The goal is to find which rate moved first.
Partition-level detail prevents a misleading average from taking over the investigation. If every partition shows similar growth, an aggregate rate mismatch is plausible. If one or two partitions dominate the gap, look at key distribution, partition leadership, and the consumer instances assigned to those partitions. More consumer processes cannot create parallelism inside a single partition.
Use the standard group view as a starting point, not as the whole investigation:
kafka-consumer-groups.sh \
  --bootstrap-server "$BOOTSTRAP" \
  --describe \
  --group "$GROUP"
Record the topic, partition, current offset, log-end offset, lag, and consumer ID at the same time as the application and broker metrics. The command syntax and available fields vary by Kafka distribution and version, so use the client tools shipped with the cluster under investigation.
3Three families of Kafka lag causes
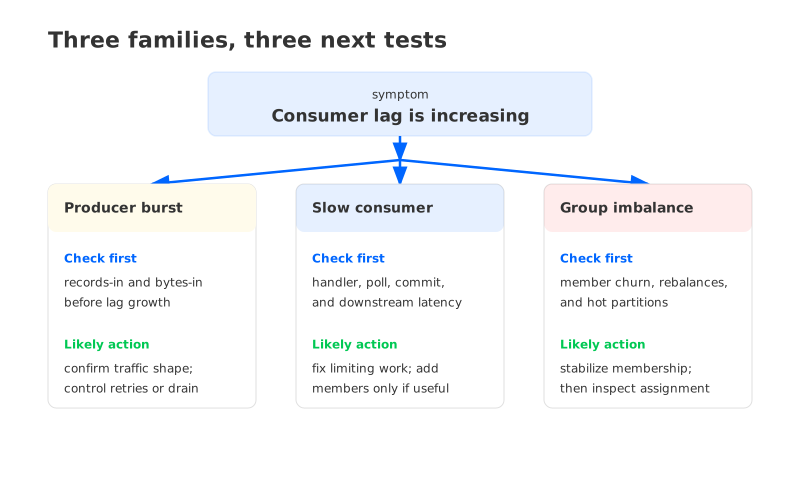
Once the rates are visible, most rising-lag incidents fall into three families. They can overlap, but separating them gives the on-call engineer a useful next test.
3.1Producer bursts create backlog faster than normal
A producer burst is not necessarily a producer failure. Traffic may be valid and the consumer may be operating exactly as designed. The problem is that the arrival rate temporarily exceeds the group's sustainable completion rate. This often happens during scheduled exports, cache warmups, retry storms, or a change that sends more keys to the same partition.
Look for a step change in records-in or bytes-in before consumer throughput changes. Compare the burst with partition-level lag: a uniform rise suggests the whole workload increased, while a skewed rise suggests the producer's partitioning pattern changed. Also check whether the consumer is already draining the backlog. If completion rate is now above arrival rate, scaling may add risk without shortening the incident materially; the important calculation is recovery time against the freshness requirement.
The safe response is usually to confirm the traffic is expected, reduce avoidable retries, and decide whether temporary producer throttling or planned consumer capacity is appropriate. Do not call a healthy consumer “slow” just because it cannot absorb an unbounded burst.
3.2Consumers become slower or stop completing work
The second family is a genuine consumer-side bottleneck. Handler time may rise after a deployment, a downstream database may throttle, deserialization may become more expensive after a schema change, or retries may turn one record into several attempts. The group can remain stable while its completion rate falls.
This case is easiest to verify by comparing application processing time with fetch and broker service time. If the consumer is receiving records but spends longer inside the handler, changing broker capacity is unlikely to help. If poll cadence approaches max.poll.interval.ms, the client may also leave the group, turning a slow handler into a coordination problem. Treat client configuration as a constraint to measure, not a knob to increase blindly.
A useful consumer-side evidence set includes handler duration by percentile, records returned per poll, time between polls, commit latency, retry and error counts, downstream request latency, and the number of active members. The first remediation should change the limiting work: fix the dependency, reduce unnecessary retries, adjust batch behavior, or add consumers only when partitions and downstream capacity support that move.
3.3Rebalances interrupt progress or leave work unevenly assigned
The third family is group coordination. A member can restart, miss heartbeats, exceed its processing interval, or join and leave repeatedly. During a rebalance, assignments change and processing may pause or become uneven. The lag metric is then reporting the consequence of lost processing time, not a storage shortage.
The tell is timing. Plot group state, member count, assignment changes, and rebalance duration beside lag. If lag jumps after membership churn, inspect pod evictions, container OOMs, network interruptions, rolling deployments, and client settings before adding instances. If the group returns to stable state but one partition remains hot, the incident has moved from coordination to partition distribution.
Rebalance faults are particularly easy to misread because a new consumer deployment can make the graph worse while appearing to add capacity. Stabilize membership first. Then verify the assignment and lag distribution. A group with more members is not necessarily a group with more useful processing capacity.
4Verification that narrows the cause
The shortest path through an alert is a sequence of comparisons. Start with the time axis, because “lag is high” is less useful than “lag began growing immediately after this rate or state changed.” Then use the evidence that distinguishes the three families.
| First comparison | What it can show | Next check |
|---|---|---|
| Records in vs. records completed | Arrival rate exceeded completion rate, or completion fell | Producer traffic shape and consumer processing time |
| Group lag by partition | One partition or many partitions are accumulating work | Key skew, assignment, and partition leadership |
| Handler time vs. fetch latency | Time entered in application work or in the Kafka fetch path | Downstream calls, poll timing, broker request metrics |
| Group state vs. lag growth | Coordination pauses line up with backlog growth | Member churn, heartbeat failures, and deployment events |
| Lag now vs. lag slope | Backlog is draining, flat, or still growing | Recovery time against the business freshness target |
This is also where storage needs to be placed correctly in the investigation. A slow broker fetch path can limit consumers, especially during historical reads or cache misses. But a storage metric is not a substitute for consumer evidence. If the application handler is the limiting stage, changing the storage architecture will not make the downstream database process records faster. If fetch latency rises while consumer processing remains steady, the broker and storage path become credible suspects.
5What changes with AutoMQ's storage model
The rate-based diagnosis still applies to AutoMQ. Kafka compatibility preserves the application-facing concepts that matter here: topics, partitions, consumer groups, offsets, and fetches. A consumer that is behind because its handler is slow remains behind after a platform change.
The platform question changes when the evidence points to storage and broker coupling. AutoMQ uses a shared-storage architecture in which durable stream data is backed by object storage and brokers are designed as more stateless compute. That separation means retention growth does not have to be handled as a proportional expansion of broker-local log disks. It can also reduce the amount of partition data that must move when broker capacity changes, subject to the target deployment and workload.
That does not make consumer lag a storage problem by definition. Consumers still pay for the read path. A catch-up workload can create object-storage requests, cache misses, network pressure, or read amplification, and those effects can lower completion rate. In an AutoMQ investigation, keep the same consumer-side metrics while adding storage-path health, cache behavior, object-storage request latency, and broker compute pressure. The point is to move the bottleneck boundary when the workload justifies it, not to rename every lag alert as an architecture issue.
Teams evaluating this model should replay their own failure modes: a producer burst, a slow downstream dependency, a rolling consumer deployment, a rebalance, and a historical catch-up. Compare the time to restore freshness, the operational steps required, and the evidence available at each layer. The AutoMQ architecture documentation explains the shared-storage design and its operational implications; the decision still belongs to the workload.
6A five-minute triage for a lag alert
When the page is active, use a fixed order so the first remediation does not destroy the evidence needed for the second. The following sequence is short enough for an incident and strict enough to prevent “add capacity” from becoming the only question.
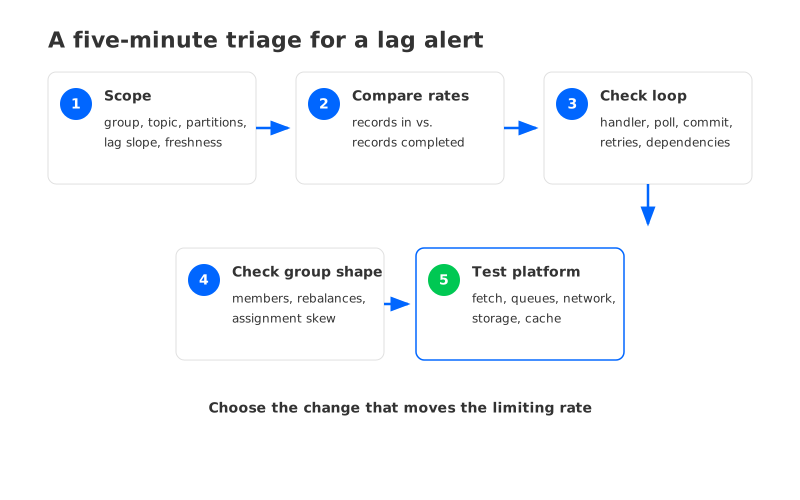
- Minute 1, scope the symptom. Identify the group, topics, affected partitions, current lag, lag slope, and event-age or freshness impact. Capture a screenshot or sample before restarting anything.
- Minute 2, compare the rates. Check records and bytes entering the partitions against records completed by the group. Mark which side changed first and whether the backlog is still growing.
- Minute 3, check the consumer loop. Inspect handler duration, poll interval, commits, retries, downstream latency, and member health. If processing time rose, keep the investigation with the application path.
- Minute 4, check group shape. Look for rebalances, member churn, assignment skew, and a single hot partition. Stabilize membership before adding instances.
- Minute 5, test the platform hypothesis. Only now inspect broker fetch latency, request queues, network, disk or object-storage reads, and cache behavior. Choose a capacity change only when those signals match the lag slope.
The final question is not whether lag is present. It is whether the group is making progress at a rate that meets the freshness requirement, and what limits that rate. That answer tells you whether to wait for a burst to drain, fix the consumer, stabilize a rebalance, rebalance partitions, or evaluate a different storage boundary.
For teams whose incidents repeatedly reach broker-local storage, replay, or capacity movement, the next step is a workload-based architecture assessment. Start with the AutoMQ project overview, reproduce the lag pattern you already understand, and keep the same success criterion: restore consumer freshness without moving the bottleneck out of sight.
7FAQ
7.1What is Kafka consumer lag?
Kafka consumer lag is the gap between data available at a partition's log end and a consumer group's progress. The exact metric may use committed offsets, current positions, or records lag, so confirm the definition used by your monitoring system before comparing dashboards.
7.2What causes Kafka lag to increase?
Lag increases when records arrive faster than the group completes them, or when group coordination pauses progress. Common causes include producer bursts, slow handlers, downstream throttling, partition skew, consumer restarts, rebalances, and broker or storage fetch pressure.
7.3Will adding consumers fix a Kafka lag problem?
Only when the topic has enough partitions, assignments are useful, the consumer code is the limiting factor, and downstream systems can accept more work. More instances do not fix a hot partition, a rebalance loop, or a saturated dependency.
7.4How should I troubleshoot a Kafka consumer group with rising lag?
Capture lag by partition, records-in, records-completed, handler time, poll and commit timing, group membership, and rebalance events. Then compare the timestamps. The first metric that changes before the lag slope changes usually gives you the shortest path to the limiting layer.
7.5Can a shared-storage Kafka architecture eliminate consumer lag?
No. Shared storage can change how broker compute, durable data, and recovery work are coupled, but it cannot fix slow consumer code or a downstream system that cannot keep up. It is worth evaluating when storage reads, broker-local data movement, or capacity changes repeatedly limit recovery.


