
Table of Contents
Table of Contents
A diskless Apache Kafka® cluster can look healthy while a consumer is waiting on a cold read, an object-storage request is retrying, or a broker is spending its network budget on compaction. A Kafka dashboard that shows only broker CPU, request latency, and consumer lag leaves out the path that moved the bytes. The operational question is therefore precise: can an on-call engineer connect a Kafka symptom to the cache, object storage, network, or metadata boundary that caused it?
Observability for diskless Kafka is a correlation problem. The same fetch can be served from a hot cache or from object storage, and the resulting lag or latency can look similar until the storage path is visible. A production framework should make those paths explicit, preserve Kafka’s application signals, and attach an action to every alert.
1What observability means in a diskless Kafka design
A useful dashboard starts with an event and follows it through the system. A producer append creates Kafka traffic and advances a partition’s log end offset. The broker schedules the request, the storage layer persists or retrieves bytes, and a consumer advances its position. If any of those signals is displayed without the others, the chart describes a symptom rather than a cause.
Keep four measurement layers together:
| Layer | Questions to answer | Evidence to retain |
|---|---|---|
| Kafka health | Are brokers, controllers, partitions, requests, and consumer groups making progress? | Active and fenced brokers, offline partitions, request errors, request and response queue time, log end offsets, commit offsets, and consumer lag |
| Data cache | Did the requested range come from a hot local path, or did the broker fetch it remotely? | Hit and miss counts, eviction pressure, prefetch activity, cache fill time, and the range that triggered a miss, when the deployment exposes those signals |
| Object storage | Is the durable stream path accepting, serving, and compacting data? | Object count and size by state, upload and download bytes, request latency and errors, retries, and compaction backlog |
| Network | Is traffic reaching the intended endpoint without queueing or saturation? | Inbound and outbound bytes, available bandwidth for cold reads and compaction, limiter queue time, endpoint placement, and transfer errors |
These layers have different owners, so the labels matter. A rising consumer lag can belong to the application, a partition leader, a cache policy, an object-storage endpoint, or a network boundary. Put cluster, broker, topic, partition, consumer_group, storage_endpoint, and operation into the same time series model where the cardinality budget allows it. When a label is unavailable, keep the missing dimension visible instead of guessing at ownership.
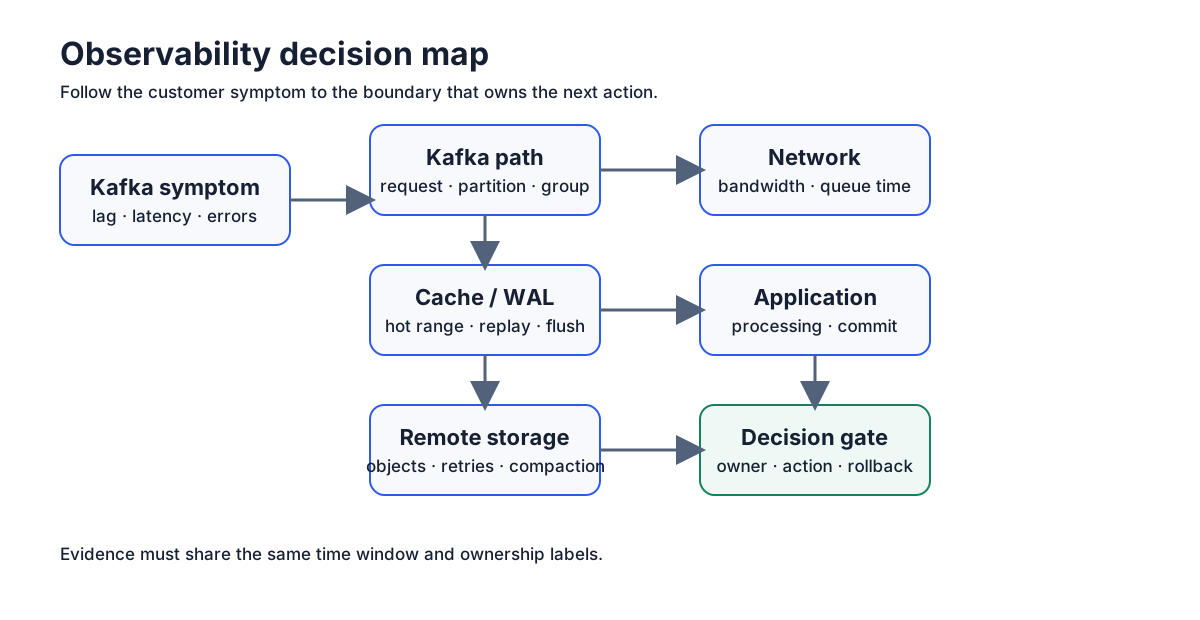
The first dashboard should be a timeline, not a wall of gauges. Plot the latest offset and committed offset with fetch and produce rates, then overlay cache misses, remote reads, object-store latency, and network queue time. A lag alert becomes actionable when the on-call engineer can see that the offset gap began at the same moment as a cold-read queue, an object-store error, or a consumer processing stall. The symptom-first framing in Consumer Lag Is a Symptom is useful for separating the alarm from the component creating the backlog.
2The mechanism: brokers, cache, metadata, and object storage
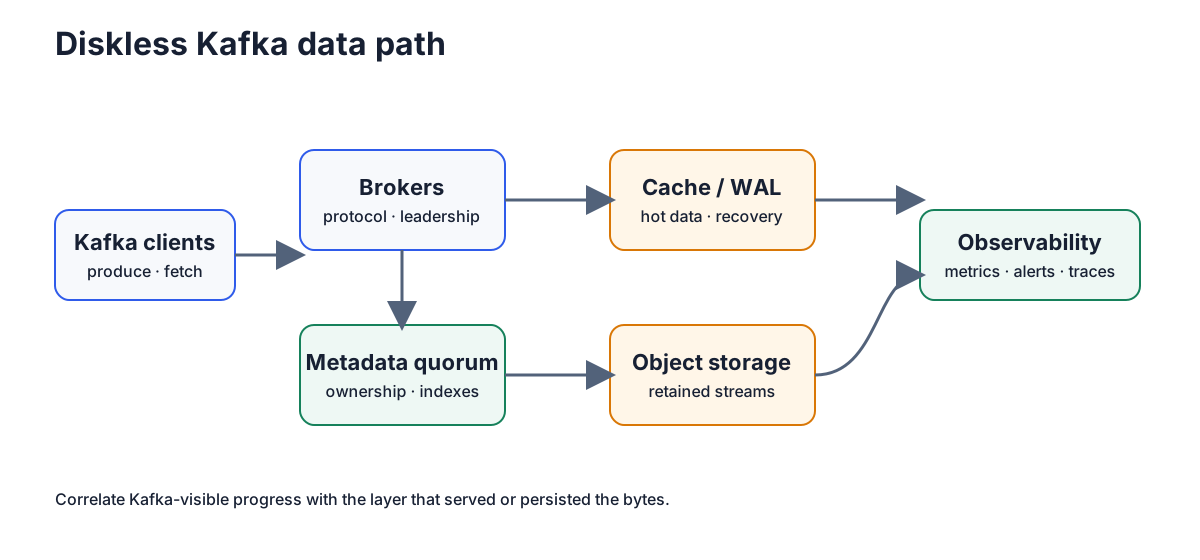
Diskless Kafka changes where durable bytes live, but the Kafka protocol still presents topics, partitions, offsets, leaders, and consumer groups to clients. A broker handles protocol requests and partition ownership. A metadata quorum records the ownership and object mapping needed to recover that state. A cache and write-ahead log (WAL) serve hot or newly written data, while object storage holds the retained stream according to the selected architecture.
That path creates distinct observability boundaries. A produce request can be accepted after the configured durability boundary is reached, while background work uploads and compacts objects. A tailing fetch can read data that is already hot. A replay or catch-up fetch can request an older range, fill the cache, and consume network bandwidth from the object-storage endpoint. The metric names may differ by implementation, but the evidence chain must preserve these transitions.
Use the following path worksheet for every alert or incident:
| Path stage | What to measure | What the measurement rules out |
|---|---|---|
| Client and protocol | Produce and fetch request counts, request size, request errors, and request queue time | A storage explanation when the client or broker request path is already saturated |
| Partition and metadata | Log end offset, committed offset, leader changes, offline partitions, and metadata or ownership events | A cache explanation when the partition is unavailable or ownership is unstable |
| Cache and WAL | Hit or miss behavior, eviction pressure, prefetch, flush latency, and WAL recovery activity | An object-storage explanation for a delay served entirely from a hot or durable local path |
| Object storage | Uploaded and downloaded bytes, object states, object size, request latency, retries, and compaction progress | An application explanation when remote reads or writes are the first signal to move |
| Network | Broker ingress and egress, reserved cold-read bandwidth, limiter queue time, and endpoint errors | A broker CPU explanation when the request is waiting at a network or rate limiter boundary |
| Consumer application | Poll cadence, records and bytes processed, processing time, and commit progress | A Kafka storage explanation when the consumer receives data but does not advance |
The order is deliberate. Start with the Kafka event that the customer can see, then follow the byte path until one boundary explains the change. A single high object-store latency sample is not enough to assign blame; it becomes useful when it lines up with a cold-read queue, a fetch response delay, and a consumer-position plateau.
Metadata deserves its own view. A broker can have available network and storage bandwidth while a partition remains unavailable or a controller is not advancing ownership. Track active and fenced brokers, offline partitions, controller activity, and the delay of any automatic balancing signal beside storage metrics. Recovery evidence should show when metadata ownership became usable, when the broker could read the required range, and when the consumer resumed progress.
3Failure, cost, and compatibility checks
Observability earns its place during a failure drill. Inject one dependency fault at a time and record the expected signal, the safe operator action, and the time at which the workload recovers. A drill that ends with “lag went down” is incomplete if the team cannot say whether the cache warmed, the object store recovered, or the application reduced its input rate. The same symptom-to-owner discipline appears in Kafka Alerting Starts with Customer Symptoms, where leading signals are tied to a threshold and an owner.
| Failure drill | Signals that should move together | Production decision |
|---|---|---|
| Broker restart during tailing reads | Broker readiness, leader change, cache warm-up, fetch latency, and consumer position | Whether the replacement can serve hot data before a replay reaches remote storage |
| Replay from an older offset | Cache misses, object-store downloads, cold-read limiter queue time, fetch latency, and lag | Whether the cold path meets the freshness objective and its network budget |
| Object-storage latency or errors | Upload/download errors, retries, object state, broker request latency, and consumer progress | Whether to back off, fail over, or stop additional work while preserving the recovery boundary |
| Network saturation or endpoint isolation | Ingress and egress, available bandwidth, limiter queue time, request errors, and storage latency | Whether placement, endpoint routing, or a traffic limit owns the incident |
| Consumer member loss | Group state, partition assignment, commit progress, and lag by partition | Whether the lag is an application rebalance event rather than a storage fault |
Cost checks use the same path. Separate broker compute, cache or WAL capacity, object-storage bytes, object-storage requests, inter-zone traffic, egress, and observability ingestion. A replay can increase object-store downloads and request volume without changing retained data. A compaction policy can reduce the number of objects while adding network work. Record the provider, region, endpoint topology, retention policy, and workload shape before comparing a diskless design with a local-disk or tiered-storage deployment.
Compatibility is another observability boundary. Test the producer and consumer libraries, authentication, quotas, transactions, Kafka Streams state stores, Kafka Connect workers, and monitoring exporters used by the workload. Apache Kafka’s KIP-405 and KIP-1150 explain related storage directions, but a proposal does not prove that a selected release or implementation exposes the same metrics or failure behavior. The KIP review workflow turns that distinction into an architecture review question: which semantics and operational evidence must the selected implementation prove? The pilot should capture the client-visible result and the storage-path evidence for each scenario.
An alert should also have a cardinality policy. Topic and partition labels are valuable during an incident, but retaining every high-cardinality series forever can make the monitoring system the next bottleneck. Keep detailed series for the investigation window, aggregate by topic or consumer group for longer retention, and preserve a trace or event link when a series is downsampled. The goal is a query that answers “which path is slow?” without asking the observability backend to reconstruct the whole cluster.
4How AutoMQ changes the operating model
Once the worksheet shows that durable storage and broker compute are the boundary you need to measure independently, a Kafka-compatible Shared Storage architecture becomes a candidate. AutoMQ keeps the Kafka client boundary while using S3Stream, WAL storage, data caching, and S3-compatible object storage as the stream data path. The architecture overview describes how this separates broker compute from durable stream data.
That separation changes what a recovery dashboard must prove. A replacement broker does not restore a partition by copying an entire retained log from its local disk. It must regain metadata ownership, reach the selected WAL and object-storage endpoint, fill the required cache range, and return Kafka responses. Observability therefore shifts from “is this disk full?” to “which stage is preventing this range from being served?” The question is still operational, but the evidence is more specific.
AutoMQ’s published Prometheus catalog gives the framework concrete anchors. Kafka request, broker, topic, partition, group, and consumer-lag metrics preserve the application-facing view. S3Stream metrics include Kafka_stream_s3_object_count, Kafka_stream_s3_object_size_bytes, Kafka_stream_upload_size_bytes_total, and Kafka_stream_download_size_bytes_total, which expose object state and byte movement. Network metrics such as Kafka_stream_network_inbound_available_bandwidth_bytes and Kafka_stream_network_outbound_available_bandwidth_bytes show the bandwidth reserved for cold reads and compaction, while limiter queue-time metrics reveal when that work is waiting. The Prometheus metrics reference is the source of truth for names, labels, and types.
Those signals still need deployment context. AutoMQ documentation describes Prometheus-compatible collection through remote write or an exporter, and the monitoring guide includes cluster, broker, topic, and group views. Use the Prometheus monitoring guide to wire collection, then keep storage-path panels beside the Kafka panels instead of putting them in a separate operations silo. If a deployment exports to another backend, preserve the same labels and alert ownership even when the dashboard syntax changes.
WAL choice also belongs in the dashboard metadata. AutoMQ Open Source supports S3-compatible storage as its WAL option, while commercial editions can use other WAL forms depending on deployment. A WAL acknowledgement, an object-storage upload, and a consumer-visible fetch are different points in the durability and recovery chain. Record the WAL type, object-storage endpoint, cache policy, and failure domain next to every benchmark and incident; otherwise a metric comparison can mix results from different storage paths.
5Decision checklist and FAQ
A diskless Kafka pilot is ready for production review when the team can answer the following without opening a second dashboard or asking who owns the alert:
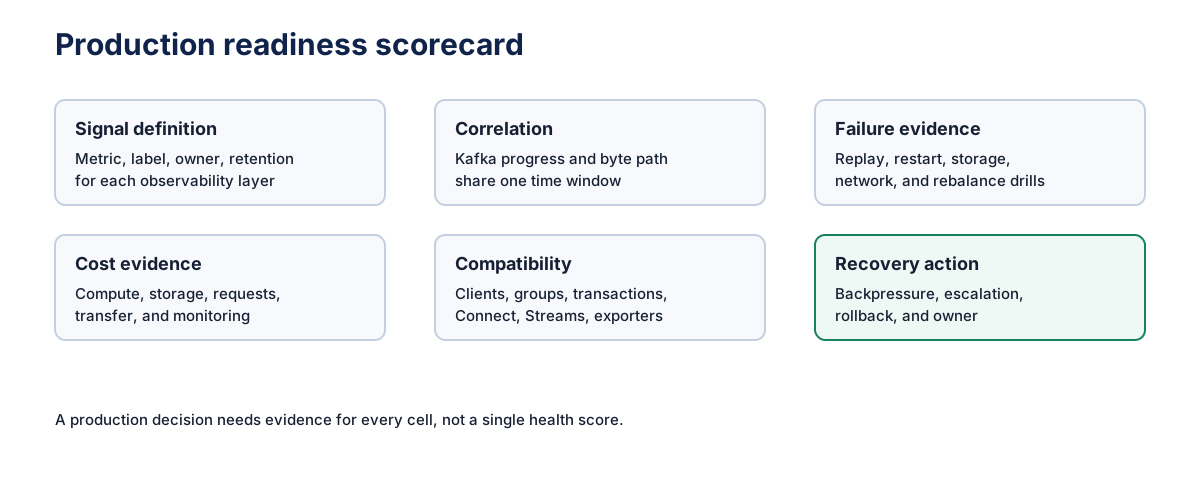
- Signal definition: Kafka health, cache behavior, object storage, network, and consumer progress each have a named metric, label, owner, and retention policy.
- Correlation: Every alert links log end offset or consumer position to request latency, cache behavior, storage reads or writes, and network queue time over the same interval.
- Failure evidence: Broker restart, replay, object-storage degradation, network saturation, and consumer rebalance have been rehearsed with production-shaped records.
- Cost evidence: The workload records compute, cache or WAL, object-store bytes, object-store requests, network transfer, and monitoring ingestion as separate lines.
- Compatibility evidence: Client libraries, group behavior, transactions, Connect, Streams, authentication, quotas, and exporters pass the same drills.
- Recovery action: Each dependency failure has a backpressure, escalation, and rollback action with an owner.
5.1Which metrics should an on-call engineer see first?
Start with the highest-lag partitions and their consumer members, then show the latest offset, committed offset, fetch latency, request queue time, cache miss or eviction behavior, object-store downloads, and network limiter queue time. Add broker and controller state so an unavailable partition is not mistaken for a slow storage read. The first screen should help the engineer choose between an application stall, a partition or metadata problem, a cache boundary, an object-storage dependency, and a network limit.
5.2Does diskless Kafka remove the need for Kafka metrics?
No. Kafka request, partition, group, and consumer metrics remain the customer-facing contract. Diskless Kafka adds storage and network boundaries that must be correlated with those signals. A storage metric without its Kafka counterpart cannot show whether users experienced a delay.
5.3How is this different from monitoring Kafka Tiered Storage?
Both architectures can use object storage, but their durable boundaries differ. Tiered Storage commonly keeps an active local tier and moves older segments to a remote tier. A diskless design treats shared storage as the durable boundary for the topic, so broker replacement, cache behavior, and remote reads need a different recovery view. Validate the implementation and release you plan to run, then use the same replay and failure drills to compare the paths.
5.4What should a cost review include?
Keep broker compute, cache or WAL, object-store capacity, object-store requests, inter-zone traffic, egress, and monitoring ingestion separate. Tie each line to the workload that produced it and to the endpoint topology that carried it. This prevents a storage-only comparison from hiding request or network costs.
The next time a lag line rises, start with the byte path rather than the dashboard color: identify the partition, locate the requested range, and follow it through the cache, WAL, object storage, metadata, and network. That turns diskless Kafka observability into an operating practice with evidence and ownership. To run the same worksheet against a production-shaped workload, start an AutoMQ evaluation.


