
Table of Contents
Table of Contents
The budget request says "a five-figure amount for an Apache Kafka deployment." Finance sends it back with a reasonable question: which products create that spend, what will change next quarter, and who owns the decision if the number rises?
The platform team has the answers, but they are usually in a different vocabulary. They have broker-hours, retained bytes, partition counts, consumer groups, replication traffic, and object-storage requests. None of those are wrong. They are not yet a financial report.
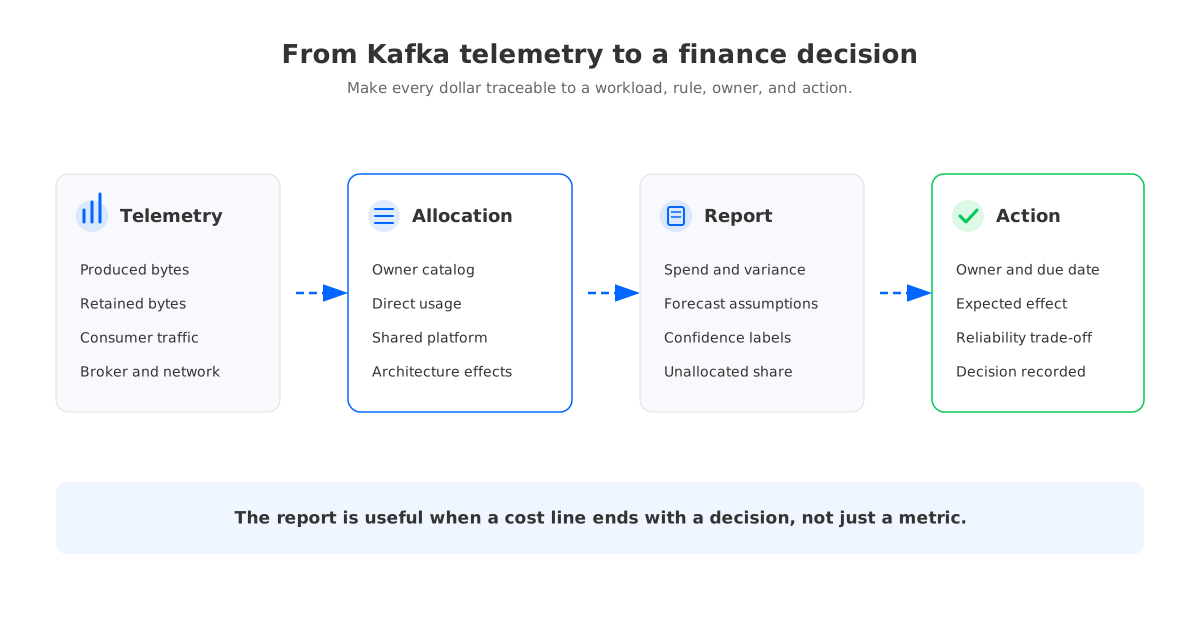
Streaming FinOps starts when those measurements become an explainable chain: workload, infrastructure driver, allocation rule, dollar amount, trend, and action. That chain is the practical form of a Kafka chargeback model. The goal is not to make Kafka look inexpensive. It is to make the cost model precise enough that Finance can approve it, product teams can influence it, and platform engineers can defend its reliability assumptions.
1Finance cannot sign off on partitions
Partitions are useful operating units. They are not automatically useful cost objects. A topic with many partitions may have low traffic but high metadata and scheduling overhead. Another topic may use fewer partitions while retaining far more data and serving several consumer groups. Splitting a bill by partition count can be easy to automate and still misrepresent what a product consumes.
The same problem appears when a team reports only broker count. Brokers carry compute, local or attached storage, availability headroom, replication work, and recovery capacity. A product team may use a small portion of the producer throughput but keep a long retention window or run frequent replays. A second team may produce more bytes but retain them briefly. Their cost drivers are different even when both use the same cluster.
Start the report with a workload ledger rather than an invoice export. For each topic family or service, collect:
- Ownership: product, team, cost center, technical owner, and business owner.
- Write footprint: produced bytes, peak rate, compression behavior, and partition share.
- Retention footprint: retained bytes, retention policy, compaction, and replay requirement.
- Read footprint: consumer groups, consumed bytes, connector traffic, and backfill volume.
- Platform footprint: broker capacity, storage, network paths, and operational exceptions.
This ledger does not need to assign every dollar immediately. Its first job is to show which technical facts explain the bill. A finance partner can then review the allocation rules without having to infer architecture from a cloud provider SKU.
2Chargeback, showback, and unit economics
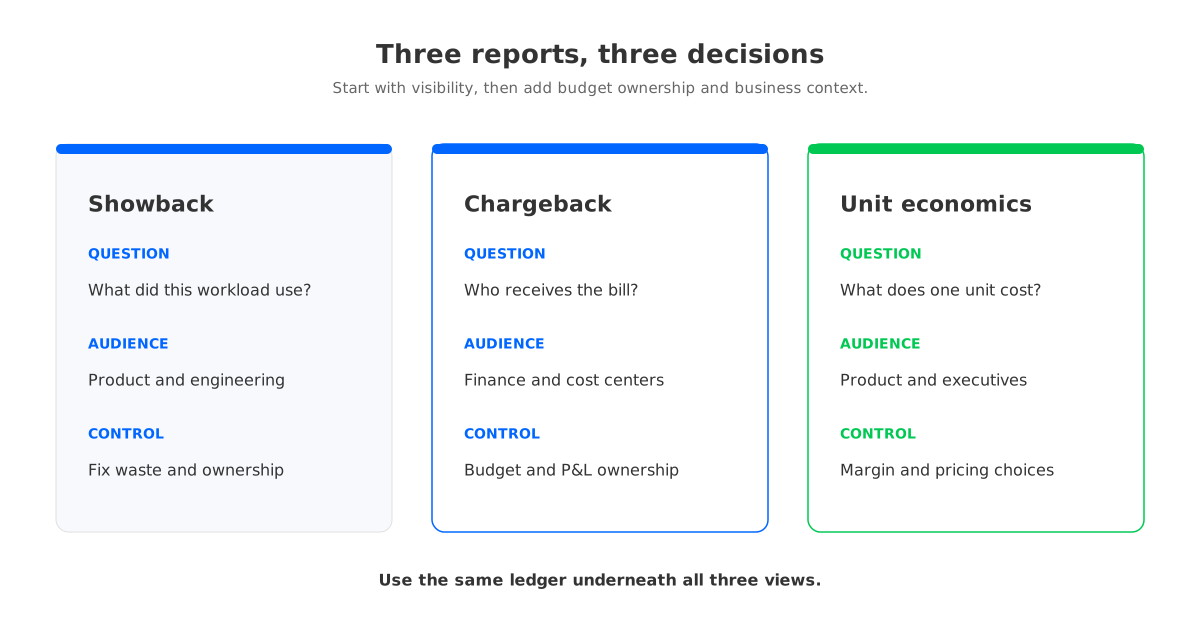
These three terms describe different decisions. Treating them as synonyms creates arguments about fairness before anyone has agreed on the purpose of the report.
| Reporting mode | What it answers | Typical audience | Control it enables |
|---|---|---|---|
| Showback | What did this workload use, and how did it change? | Product and engineering leaders | Fix ownership, retention, traffic, or capacity waste |
| Chargeback | Which cost center receives the bill? | Finance, business units, procurement | Include platform spend in a budget or P&L view |
| Unit economics | What does one useful business unit cost? | Product, finance, executives | Compare stream cost with orders, sessions, devices, or revenue |
Showback is usually the most practical starting point because it makes the model visible before money moves between budgets. A team can challenge an owner tag, a retention classification, or a replay allocation while the first reports are still informational. Chargeback should follow when the measurements and dispute process are stable enough that teams trust the result.
Unit economics adds a second layer. Kafka spend per GiB is an infrastructure ratio; it may be useful for comparing workloads, but it is rarely the business metric a product leader manages. Depending on the product, a more useful denominator could be cost per million orders processed, per active device-day, or per customer session. The denominator must be chosen by the product owner and kept consistent across reporting periods.
Do not force every shared cost into a workload formula. Separate direct usage from shared reliability work:
- Direct usage: produced bytes, retained bytes, consumed bytes, replay traffic, and partition share.
- Shared platform: controller capacity, baseline observability, security controls, on-call coverage, and failure headroom.
- Architecture effects: replication traffic, cross-AZ transfer, storage amplification, request charges, and movement during scale or recovery.
The first category can usually be allocated from metrics. The second needs an agreed policy. The third needs a technical explanation because it is where a valid workload requirement can become an unexpectedly large bill.
3Tagging streams so costs have owners
Tags are useful only when they survive the path from a Kafka record to a report row. A cloud resource tag on a broker does not identify the product that owns a topic. A topic name does not reliably identify a cost center if naming conventions drift. Build an ownership map that connects application metadata to infrastructure and finance dimensions.
At minimum, the map should resolve this chain:
topic family -> service -> team -> product -> cost center
Add the dimensions that change cost behavior: retention class, data criticality, environment, region, and whether replay is part of the service contract. A consumer group should be attributed to the service that operates it, while shared downstream consumers need an explicit allocation rule. A replay job should not disappear into the normal consumer total only because it uses the same client library.
For a monthly pipeline, join four data sources:
- Kafka metrics and configuration exports for topics, partitions, retention, consumer groups, and bytes.
- Cloud billing exports for compute, attached storage, object storage, requests, and network.
- An ownership catalog for teams, products, cost centers, and exceptions.
- A change log for retention edits, new consumers, replays, migrations, and incidents.
The join does not have to be perfect on day one. Report an unallocated bucket and show its percentage. An unallocated line is more honest than assigning unknown traffic to the largest team. Set an owner and due date for the bucket, then measure whether it shrinks.
Architecture determines what the join can explain. In broker-local Kafka, retained data, broker capacity, replica placement, and recovery movement are closely coupled. A topic can create cost beyond its logical write volume because availability and storage decisions multiply the physical resources behind it. A report should expose that multiplier instead of hiding it in a generic platform charge.
This is also where a shared-storage architecture can change the shape of the report. AutoMQ is a Kafka-compatible cloud-native streaming platform built around a Shared Storage architecture. Its architecture documentation describes Kafka request processing on brokers with S3Stream, WAL storage, data caching, and S3-compatible object storage beneath it.
The accounting implication is not that object storage removes every cost. It is that durable stream data, broker compute, and network paths can be modeled as more distinct dimensions. Retained bytes can be reported against storage, broker usage against serving compute, and network against measured access or placement paths. In AutoMQ BYOC, cloud resources remain in the customer's environment, so the same resource tags and account-level cost exports can feed the chargeback process. Teams still need an ownership catalog and a policy for shared costs; architecture makes the boundaries clearer, but it does not create governance by itself.
4A monthly report finance will actually read
The monthly report should fit on a few pages and answer four questions: what did we spend, why did it move, what looks abnormal, and what decision is required? A useful report has an executive summary followed by a technical appendix, not the other way around.
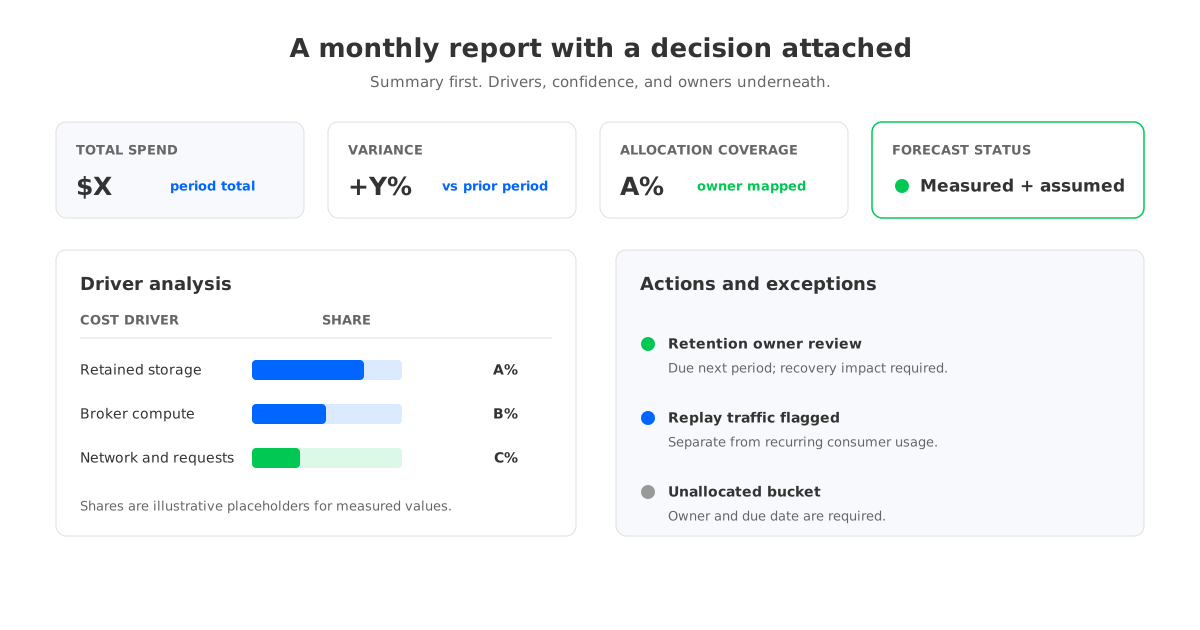
Use a consistent report shape:
| Section | Include | Finance-ready wording |
|---|---|---|
| Spend summary | Total, period-over-period change, forecast, and confidence | "Spend was $X; the change was driven by Y; forecast assumes Z." |
| Allocation | Direct, shared, architecture, and unallocated amounts | "A% is assigned to owners; B% is shared; C% needs review." |
| Driver analysis | Ingest, retention, reads, network, requests, compute, and operations | "Retained bytes grew faster than produced bytes because of longer policy on these streams." |
| Exceptions | Replays, incidents, migrations, new products, and unusual traffic | "This spike is non-recurring and has an owner and end date." |
| Actions | Decision, owner, due date, expected effect, and risk | "Team X will change retention; Platform will verify recovery impact." |
Use dollars in the summary, but retain engineering units beside each driver. A line such as "$4,200 for storage" is hard to act on. "$4,200, up 18%, driven by retained bytes in two audit streams; retention owner review due next month" connects the amount to a decision without pretending the cost is a platform defect.
Forecasts should show assumptions, not false precision. For an illustrative estimate, assume a 30-day reporting period, a measured average ingest rate, a stated retention window, the observed consumer traffic, and current provider rates. Then calculate:
forecast = compute + retained storage + network
         + object-storage requests and retrieval
         + platform and operations allocation
If the rate card, workload mix, or retention policy is likely to change, show a range or scenario instead of one exact number. Keep committed discounts, taxes, support fees, and one-time migration costs separate from steady-state usage. Every amount in the example above is a placeholder for the team's measured values; it is not a universal Kafka price.
The report should also carry a confidence label. Measured means it comes directly from billing or telemetry. Calculated means it is derived from measured inputs. Assumed means the team has not yet observed the behavior. A finance review can approve a forecast with assumptions; it cannot responsibly treat assumptions as measured spend.
5The SOP that keeps it running
FinOps reporting decays when it is a one-time spreadsheet. Assign the process to named owners and give it a short operating rhythm:
- Close the period. Freeze the billing window and export Kafka, cloud, and ownership data.
- Reconcile totals. Compare the allocation model with the provider invoice and explain any difference.
- Publish showback. Give teams their usage, cost, variance, confidence, and unresolved owner gaps.
- Review exceptions. Examine replays, cross-AZ traffic, retention changes, incidents, and migrations separately from baseline usage.
- Approve actions. Record the owner, due date, expected cost effect, and reliability or latency trade-off.
- Reforecast. Update the next period with known launches, retention changes, commitments, and architecture tests.
Keep the dispute path technical and time-bound. If a team challenges an allocation, require the exact topic, consumer group, tag, period, and evidence. If the platform team rejects a proposed optimization, state the service objective it protects: recovery time, durability, availability, or consumer freshness. “The platform needs it” is not an allocation rule; “this reserve is required by the tested recovery objective” is.
The architecture review belongs in the same process when recurring costs come from storage and data movement rather than from wasteful workload behavior. Apache Kafka documentation covers retention, replication, quotas, and log behavior; cloud provider pricing pages define the applicable meters. Use those sources to validate the model, then test any architecture change with the actual workload and failure objectives. AutoMQ's Kafka compatibility documentation can help scope that test, while its cross-AZ cost guidance describes the network behavior to examine.
When the next budget request arrives, the useful answer is not another broker count. It is a report that names the workloads, explains the cost drivers, distinguishes recurring from exceptional spend, and assigns the next decision to an owner. For teams whose ledger shows that broker-local storage and replication paths are the dominant multipliers, request a workload-specific AutoMQ review using the same ledger Finance already trusts.
6References
- Apache Kafka Documentation
- Apache Kafka Topic Configurations
- KIP-405: Kafka Tiered Storage
- AWS EC2 On-Demand Pricing: Data Transfer
- AWS S3 Pricing
- AWS EBS Pricing
- AWS Cost Allocation Tags
- AutoMQ Shared Storage Architecture
- AutoMQ BYOC Environment Overview
- AutoMQ Compatibility with Apache Kafka
7FAQ
7.1What is a Kafka chargeback model?
A Kafka chargeback model assigns streaming platform cost to teams, products, or cost centers using measured workload drivers and an agreed policy for shared reliability costs. It should explain produced bytes, retained bytes, consumed bytes, replay traffic, partitions, compute, storage, network, and operations without pretending every shared cost belongs to one workload.
7.2What is the difference between Kafka showback and chargeback?
Showback reports usage and cost without moving budget ownership. Chargeback uses the same type of evidence to assign a financial amount to a cost center. Start with showback when the ownership map or allocation rules are still being tested, then introduce chargeback after the dispute process is stable.
7.3Which Kafka metrics matter most for FinOps?
Start with produced and retained bytes, retention policy, consumer-group traffic, replay volume, partition count, broker capacity, storage footprint, and network paths. Add object-storage requests, retrieval, incidents, and operational work when those costs are material to the deployment.
7.4How should teams calculate Kafka cost per unit?
Choose a business denominator that the product team recognizes, such as orders, sessions, devices, or another useful unit. Divide the allocated streaming cost for the same period by that measured business volume, and show the workload and allocation assumptions beside the result. Cost per GiB is an infrastructure diagnostic, not automatically a business unit metric.
7.5Does shared storage eliminate Kafka cost allocation work?
No. Shared storage can make broker compute, retained data, and network paths easier to model independently, but teams still need ownership metadata, cloud billing exports, shared-cost policy, and reconciliation. Object-storage requests, retrieval, caching, WAL storage, and client traffic remain part of the report.


