
Table of Contents
Table of Contents
During an on-call shift, a consumer-lag alert tells you that a group is behind the partition end offset. It does not tell you why. A broker may be slow to fetch retained records, a VPC path may be adding latency, or the consumer process may be spending its time decoding records and waiting for a downstream system. Restarting the consumer treats all three symptoms the same way.
The useful question is where the consumer stopped making progress. Trace one partition from its end offset to the consumer’s next successful poll, then separate storage, network, and workload evidence. That path turns a generic GCP Kafka lag alert into a bounded diagnosis and gives you a safer basis for a capacity or architecture change.
1Lag is an offset symptom, not a diagnosis
Kafka consumer lag is usually expressed as the distance between a partition’s log end offset and a consumer group’s committed or current position. That distance is useful, but it is not the same as user-visible delay. A partition can accumulate many small records quickly, while another carries fewer but much larger records. Compare offset lag with lag age, fetch latency, and the timestamp of the oldest record that has not reached the consumer’s processing boundary.
Start the incident with a short evidence window. Capture the group, Topic, Partition, client instance, assignment, current position, end offset, record timestamp, and alert time. Kafka’s kafka-consumer-groups.sh command can show group positions, while the consumer configuration reference explains polling and fetch settings. Record the client version because defaults are version-sensitive.
| Signal | What it answers | What it cannot prove alone |
|---|---|---|
| Offset lag by Partition | Which partitions are behind and whether the problem is concentrated | How old the unconsumed records are |
| Lag age or record timestamp | Whether users are waiting longer than the offset count suggests | Which hop introduced the delay |
| Fetch latency and fetch size | Whether the consumer is receiving records at the expected pace | Whether processing after poll() is blocked |
| Consumer CPU, pause time, and poll cadence | Whether the client is able to process and request records | Whether the broker or VPC path is slow |
| Downstream queue or write latency | Whether work after the fetch is holding the group back | Whether the original records are available for replay |
The table keeps the investigation honest. A green consumer metric does not clear the broker, and a large offset gap does not prove a network fault. Trace the fetch path for the partitions that contribute most of the user-visible lag.
2Trace one partition across the fetch path
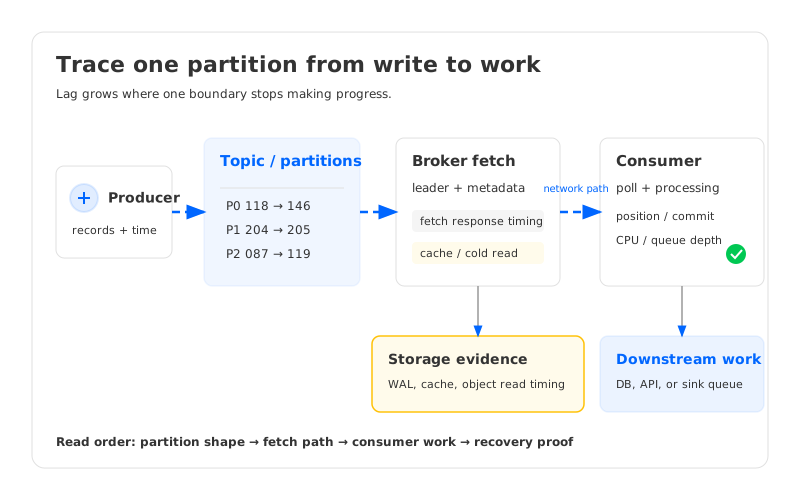
Pick a partition with a growing lag age and follow it through four boundaries: assignment, metadata, fetch, and processing. Confirm which broker is leader for the partition and which address the client received after metadata refresh. Then compare the broker’s response timing with the client’s time between polls and the time spent handling the returned records.
A minimal capture should include:
- the consumer group, Topic, Partition, leader, and client instance;
- the current position, log end position, record timestamp, and commit timestamp;
- fetch request and response timing, bytes returned, and any retry or disconnect event;
- the client’s processing interval, pause or rebalance event, and downstream response; and
- the same signals for a healthy partition in the group.
This paired comparison matters. A single slow partition may point to a hot key, a broker-level storage path, or a leader placement issue. If every assigned partition slows at the same time, look for a shared network path, consumer host pressure, or a downstream dependency instead of moving one partition.
Google Cloud Monitoring provides a way to collect and correlate service and workload metrics, but the available metric names and labels depend on the service and integration. Treat Cloud Monitoring’s metrics model as the collection boundary, then verify which Kafka, VM, GKE, or connector signals are actually exported in the target project. Do not assume a provider dashboard includes the client-side timestamp needed to compute lag age.
3Three causes that produce very different lag shapes
3.1Storage or broker fetch delay
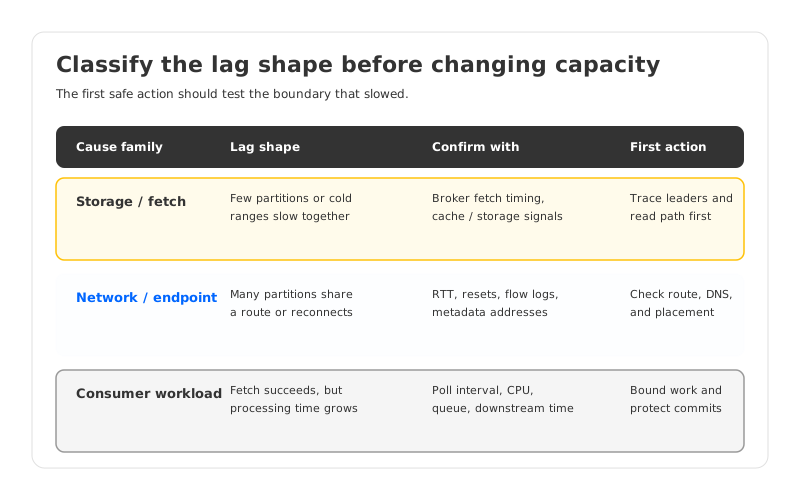
Storage pressure usually appears as fetches that return late or return fewer bytes than the consumer requests, while client processing remains available. The pattern can be localized to partitions whose data is outside a broker cache, to a broker handling a disproportionate share of leaders, or to a retention range that requires a colder read path. Check broker request timing, cache hit or miss evidence where exposed, disk or object-storage request latency, and the distribution of leaders before increasing consumer concurrency.
A consumer cannot read faster than the broker can make the requested range available. Moving the consumer will not fix a fetch path that is slow for every client. Prove whether the delay occurs before the response reaches the client, then test partition placement, storage queueing, and older-record reads. Record the offsets so any replay has a bounded range.
3.2Network path or endpoint behavior
Network issues make lag grow across many partitions that share a route, zone, endpoint, or client subnet. Look for increased round-trip time, connection resets, TLS or authentication retries, retransmits, and a mismatch between bootstrap reachability and the broker addresses returned in metadata. GCP VPC Flow Logs can provide path evidence, but flow records do not explain Kafka application timing by themselves. Join them with client fetch timing and broker request logs.
Keep the path specific. A private bootstrap endpoint does not guarantee that every advertised broker address is reachable from the consumer subnet. A connector or sidecar may also use a different egress route than the main consumer. If a cross-zone or cross-region hop is intentional, record its latency and failure behavior as part of the service objective. If it is accidental, fix the route or placement before changing Kafka fetch settings.
3.3Consumer workload and downstream backpressure
A consumer can fetch records successfully and still fall behind while it deserializes payloads, waits for a database, flushes a batch, or pauses during garbage collection. Check the interval between poll() calls, processing time per batch, worker queue depth, downstream response time, and commit behavior. A rebalance caused by a slow processing loop can add more lag even when the original workload is healthy.
Separate intake from work. Use the client’s assigned partitions and current position to see whether records are arriving, then inspect the application boundary where a record becomes complete. Increase processing parallelism only after confirming the downstream system can accept it. A larger max.poll.records value may improve throughput for one workload and increase per-poll processing time for another, so test the chosen version and payload shape rather than copying a setting from a different cluster.
4Remediate the cause, then verify recovery
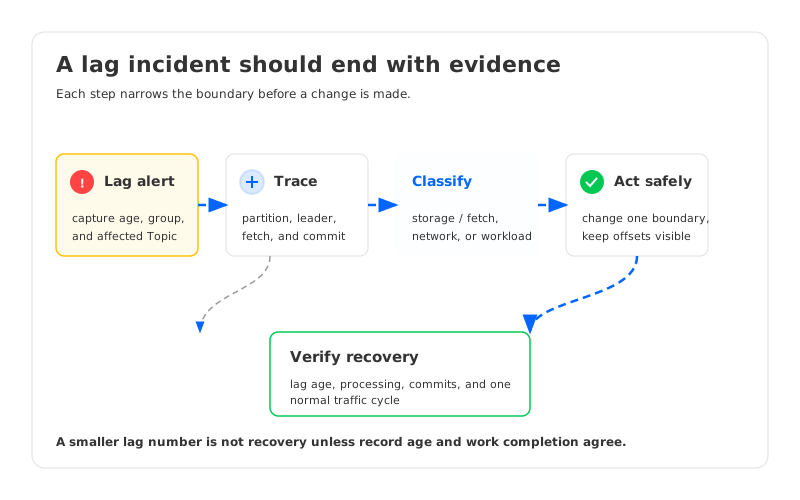
The first remediation should reduce the identified delay without hiding the evidence. For storage-led lag, test a less contended leader layout, a warmer read range, or a storage path that keeps the required replay window available. For network-led lag, correct the route, endpoint, DNS, or placement and repeat metadata refresh from every consumer subnet. For workload-led lag, isolate slow downstream calls, adjust worker concurrency, or change batch boundaries while preserving commit and retry semantics.
Use a recovery checklist that follows the same partition path used during diagnosis:
- Confirm that the affected partition receives successful fetch responses and that fetch latency returns to its baseline for the workload.
- Confirm that processing time and downstream queue depth are falling, not only that the consumer process is connected.
- Confirm that the committed position advances without an unexpected reset, duplicate replay, or rebalance loop.
- Confirm that lag age reaches the service objective and stays there through at least one normal traffic cycle.
- Save the before-and-after evidence with the configuration or route change that produced it.
Do not declare recovery when the offset gap shrinks because producers stopped. Compare producer rate, record timestamps, and a healthy partition. If lag returns after a cold read, route change, or downstream batch, the cause is still present.
5When the path points to an architecture decision
Some incidents end with a configuration fix. Others show that broker storage, compute placement, and replay requirements are coupled more tightly than the workload can tolerate. If lag appears whenever consumers catch up on older data, ask whether durable storage and broker compute need separate scaling and failure boundaries. That is a design question, not a promise that a different product removes every source of lag.
AutoMQ is a Kafka-compatible, cloud-native streaming platform that replaces broker-local log storage with a Shared Storage architecture. Its brokers handle Kafka requests, partition leadership, caching, and scheduling, while S3Stream writes durable data through WAL storage and object storage. That separation gives an evaluation team more signals to inspect: cache and WAL behavior, object-storage reads, broker request timing, and consumer fetch timing can be reviewed as related but distinct paths.
The architecture does not make a slow consumer or a broken VPC route disappear. In an AutoMQ BYOC deployment, the data plane still runs in the customer cloud environment, so IAM, network placement, storage endpoints, and consumer workload remain part of the diagnosis. The AutoMQ architecture overview helps map those boundaries. For adjacent operating evidence, compare the Kafka observability production framework and Kafka on GKE deployment patterns. Evaluate the platform with the same partition trace used for the existing GCP Kafka service:
- Can the team separate broker fetch delay, cache or WAL pressure, object-storage latency, and client processing time?
- Can it reproduce a cold-read catch-up and capture the offsets, timestamps, and recovery behavior?
- Do client, connector, and downstream paths stay within the approved GCP network and identity boundaries?
- Which metric and log surfaces are available in the target release, and who owns each one?
6FAQ
6.1Is consumer lag always a Kafka broker problem?
No. Lag is the distance between a consumer position and a partition end position. The delay can come from broker fetches, a network path, consumer processing, or a downstream dependency. Compare fetch timing with processing and downstream evidence before changing brokers.
6.2Which metric should I alert on for GCP Kafka lag?
Use a combination of offset lag and lag age, then add a signal for fetch latency and downstream processing. The useful threshold depends on the workload’s freshness objective. Verify which Kafka and client metrics are exported to Cloud Monitoring in the target project instead of assuming a provider dashboard has every field.
6.3Should I increase consumer concurrency first?
Only after proving that the consumer workload is the limiting boundary and that the downstream system can absorb more work. More consumers will not fix slow broker reads or an unreachable advertised listener, and they can increase rebalances or destination pressure.
6.4How do I test a storage-related lag incident?
Choose a bounded range and a partition with a growing lag age. Capture fetch timing, broker storage signals, client processing time, and offsets before and after the test. Run the same range through a healthy path where possible, and keep the result with the change record.
When the next GCP Kafka lag alert arrives, start with the partition that users feel, not the dashboard with the most charts. Follow its fetch path, name the first boundary that slowed, and verify the recovery against record age and processing completion. If you are evaluating a customer-owned Kafka data plane, run the same lag-path review with AutoMQ, using your GCP routes, identities, storage signals, and consumer workload as the test evidence.


