
Table of Contents
Table of Contents
A GCP Kafka benchmark can produce a convincing throughput number while leaving the production question unanswered. Change the record shape, partition distribution, producer acknowledgment policy, consumer fan-out, or storage path, and the same cluster can show a different result. The chart is not necessarily wrong. It may describe a workload that your application never sends.
Performance engineers need a benchmark that follows the workload through its hot path, cold path, and failure path. The useful output is a repeatable evidence bundle: a declared workload, a matched topology, latency distributions, recovery observations, and the resource counters that explain cost. The core argument is straightforward: benchmark the contract your application needs, then compare architectures under that contract instead of comparing headline throughput.
1Start with a workload contract
Before launching a producer, write the decision the benchmark must support. A capacity test may ask whether a cluster can absorb a sustained write rate. A platform evaluation may ask whether tail latency stays within an application objective while consumers replay older data. Those are different experiments and should not share one result row.
Capture the variables that can change the answer:
- Record shape: average and maximum record size, key distribution, compression, headers, and serialization used by the application.
- Kafka contract: topics, partitions, replication settings, producer acknowledgments, idempotence, transactions, and consumer isolation level.
- Traffic shape: steady production, bursts, fan-out, replays, and the balance between tailing consumers and historical readers.
- Failure boundary: broker or node replacement, storage-path interruption, network impairment, or a controlled consumer restart.
- Decision rule: the freshness, durability, recovery, and cost conditions that make a run acceptable.
This contract prevents a common comparison error. If one candidate is tested with a single consumer and another with the production fan-out, the test is comparing traffic shapes. If one run acknowledges after a durable write and another relaxes the acknowledgment path, the test is comparing durability contracts. The workload record should make those differences visible before a graph is drawn.
2Match the topology before matching the numbers
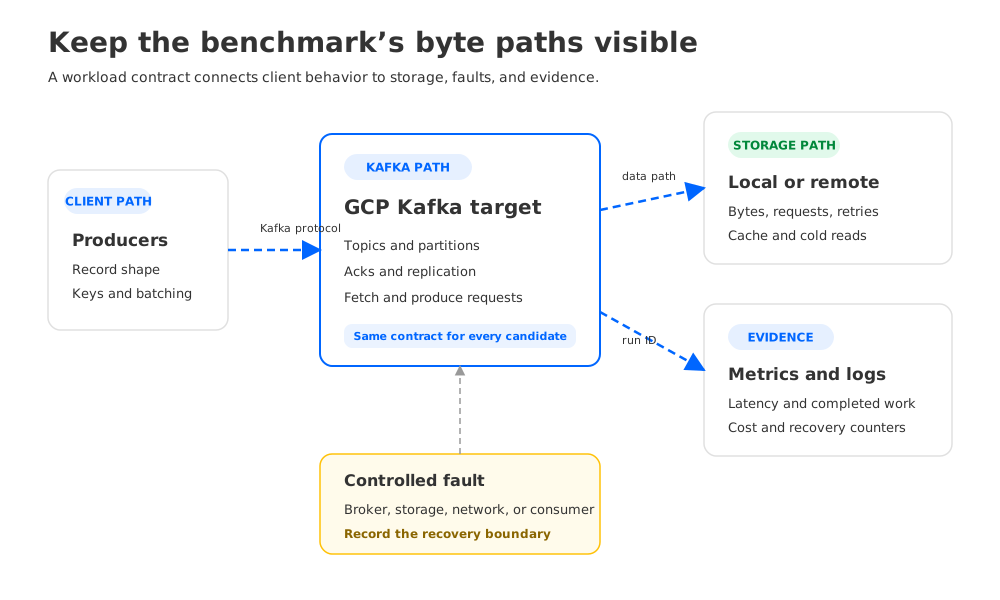
Google Cloud’s Managed Service for Apache Kafka has its own service boundary, resource model, and documented monitoring path. Self-managed Kafka on Compute Engine or GKE exposes a different set of operator choices. A fair GCP Kafka performance test does not force these models into identical infrastructure. It records the boundary each option owns, then compares the work required to satisfy the same Kafka contract.
The topology manifest should include:
| Area | Record before the run | Why it changes interpretation |
|---|---|---|
| Client path | Client machine type, count, region, zone, DNS path, and security controls | A client-side CPU or network limit can look like broker saturation |
| Kafka path | Broker or service shape, topic and partition layout, replication and acknowledgment settings | Capacity and durability work depend on the Kafka contract |
| Storage path | Local SSD, block storage, remote service, or object storage, with cache policy | Tailing and historical reads may use different physical paths |
| Control path | Deployment API, IAM identity, quotas, and configuration revision | Provisioning and recovery timing can include service limits |
| Evidence path | Metrics, logs, traces, billing export, and run IDs | Without a shared timestamp, resource and result data cannot be reconciled |
Pin client and server configuration in version-controlled files. Record the Google Cloud region and zone placement, but do not turn a location into a universal performance claim. The same machine class can behave differently when the client path crosses a zone boundary or when a managed service applies a quota. The manifest is part of the result.
3Run phases that expose different bottlenecks
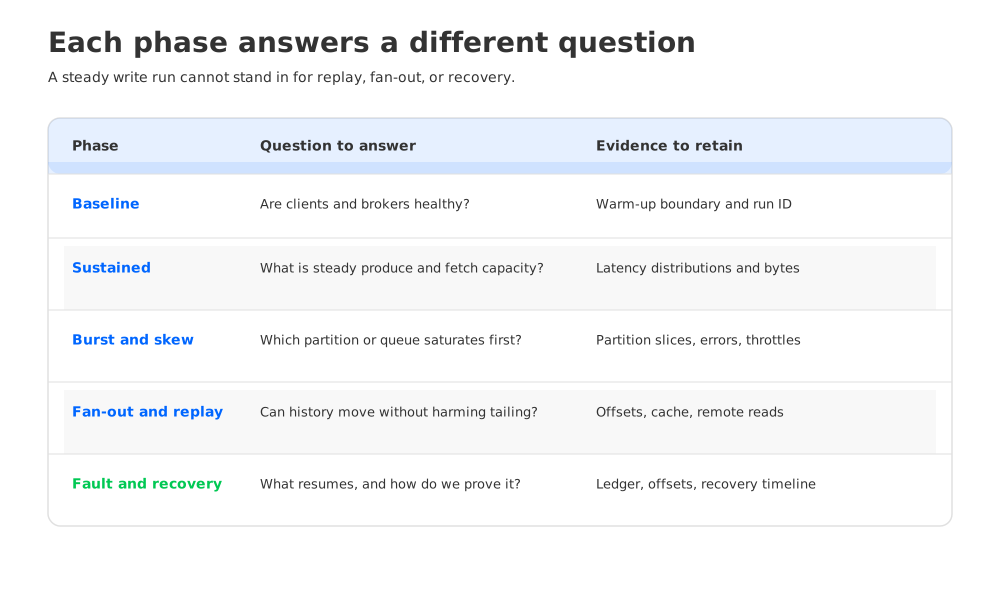
A steady-state produce test is useful, but it covers only one slice of Kafka behavior. Use a small set of phases that answer different questions and keep the same contract fields in every output.
- Warm-up and baseline. Establish that producers, brokers, consumers, and storage paths are healthy. Keep warm-up samples separate from measured samples so startup work does not disappear into an average.
- Sustained produce and fetch. Hold the declared record shape and partition distribution while measuring producer acknowledgment latency, broker request latency, fetch latency, and completed bytes.
- Burst and skew. Increase offered work or route keys toward a subset of partitions. This shows whether a cluster fails through a hot partition, a client limit, request queuing, or a storage boundary.
- Fan-out and replay. Add the consumer groups that matter to the application, then start one reader from an older offset. Compare tailing progress with historical read behavior and cache or remote-storage signals.
- Fault and recovery. Replace or isolate the component named in the contract. Capture the time until the producer and consumers resume their objectives, and preserve the records and offsets used to verify continuity.
A phase is complete when its evidence is complete, not when a command exits successfully. A replay that finishes with missing records is a failed replay. A fault run that returns to a green health check while the consumer position remains stalled has not demonstrated recovery.
4Measure distributions and completed work
A single average hides the requests that violate an application objective. Report latency distributions such as P50, P95, and P99, then keep timeout and error samples visible. For each percentile, state the measurement point: client send to acknowledgment, broker request handling, fetch response, or application processing. These points answer different questions and should not be combined into one “Kafka latency” field.
Pair latency with work completed:
- records and bytes accepted by producers;
- records and bytes returned to consumers;
- consumer position, latest offset, and record age where the application supplies timestamps;
- retry, timeout, throttle, and error counts;
- CPU, memory, disk or cache pressure, network bytes, and storage request outcomes; and
- partition-level distributions rather than only cluster averages.
The result file should preserve the time series behind the summary table. If a tail percentile rises during a burst, the operator needs to see whether request queue time, client CPU, network transfer, replication, cache misses, or storage reads moved first. A benchmark that records only the final throughput number cannot distinguish a broker limit from a client limit.
5Add recovery and cost to the same experiment
Performance and cost are connected through consumed resources, but they are not the same metric. Google Cloud’s Managed Service for Apache Kafka pricing describes separate billing dimensions such as compute, local SSD, remote storage, and network transfer. Use the current regional price sheet when converting counters into money. Do not put a price into the benchmark article unless the rate, region, date, and assumptions are recorded in the result.
For each phase, collect the counters that explain the bill:
- compute capacity held for the workload and for replay or recovery headroom;
- bytes stored by age or tier, plus storage requests and retries;
- ingress, egress, and cross-zone bytes on the paths used by clients and storage;
- extra work created by replication, compaction, cache refill, or replay; and
- time spent in recovery, including the traffic consumed while normal work continues.
This turns “cost per throughput” into a traceable calculation. A platform can complete a steady write test with low broker CPU while a replay creates remote reads and network traffic that dominate the monthly estimate. The cost section should therefore carry the same run ID as the performance section.
6Interpret results by architecture
Use the evidence to answer architecture questions, not to rank providers by a single chart.
A managed Kafka service can reduce the amount of cluster infrastructure the team operates, but the test still needs to show client behavior, connector behavior, monitoring coverage, quotas, and recovery at the application boundary. The service page can document what the platform manages; it cannot prove that a particular consumer group resumes with the expected offsets after your chosen fault.
Self-managed Kafka on GKE or Compute Engine gives the team more control over brokers, disks, placement, and configuration. That control also makes storage replacement, upgrades, balancing, IAM, and failure drills part of the benchmark owner’s work. The runbook should show who collects evidence and who acts when the result breaches the contract.
A Kafka-compatible Shared Storage architecture changes where the test observes state. Durable stream data, broker compute, cache, WAL, object storage, and metadata ownership become explicit parts of the topology. The fair test keeps the client contract constant and names the storage mode so a result from one WAL or cache policy is not mixed with another.
That last category is where AutoMQ belongs in an evaluation. AutoMQ is a Kafka-compatible cloud-native streaming platform built on a Shared Storage architecture. Its architecture overview separates Kafka protocol and compute responsibilities from WAL (Write-Ahead Log) storage, Data caching, and S3 storage. Benchmark those paths explicitly: acknowledge behavior, tailing reads, catch-up reads, cache refill, object-storage access, and broker replacement. The test does not assume a benefit; it gives the architecture a fair place to show where work moves.
For a reusable comparison protocol, see the fair Kafka benchmark methodology. Its value is the same as this GCP plan: keep the workload and evidence visible so another team can rerun the decision. The benchmark interpretation guide helps separate a measured result from a claim that still needs verification.
7Make the benchmark rerunnable
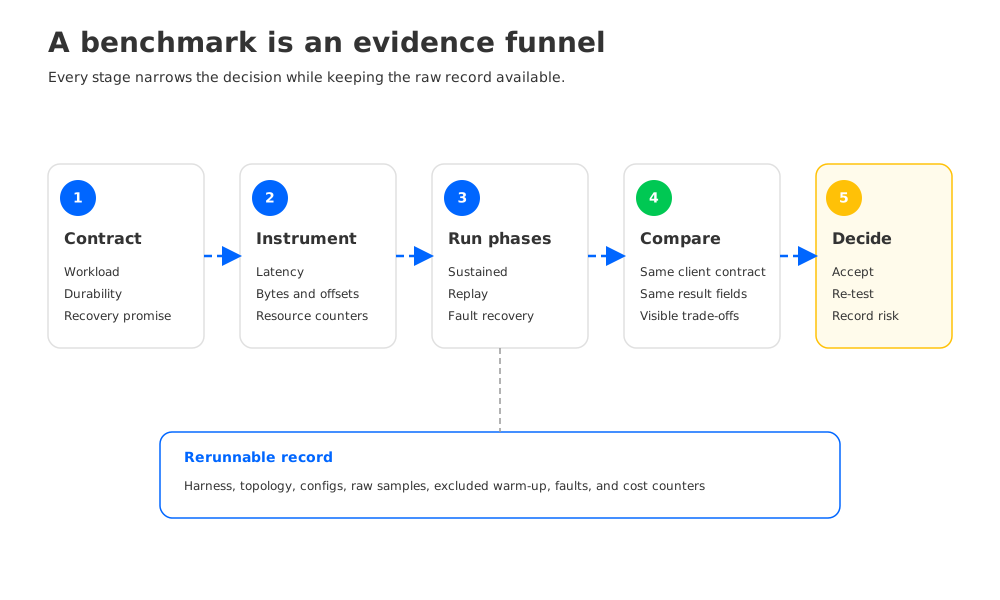
Store the harness, topology manifest, client properties, topic setup, fault script, metric queries, and result parser together. Pin the source revision for every component and give each run a unique identifier. Keep the raw samples, excluded warm-up window, errors, and resource counters beside the summary so a reviewer can reproduce the chart without relying on a slide deck.
A compact run record can use this shape:
workload: checkout-events
contract:
  record_shape: application-defined
  partitions: production-shaped
  acknowledgments: production-equivalent
  consumer_fanout: production-equivalent
phases:
  - baseline
  - sustained
  - burst
  - replay
  - fault-recovery
evidence:
  latency: client-and-broker distributions
  work: records-and-bytes
  recovery: offsets-and-record-ledger
  cost: compute-storage-network-counters
The values are placeholders by design. Replace them with the workload under review, then run the same file against each candidate. If a provider or product cannot expose one boundary, record the missing evidence as a decision risk instead of filling it with an assumption.
8FAQ
8.1What is the first test for GCP Kafka?
Start with the workload contract and a warm baseline. Then run sustained produce and fetch with the same client libraries, record shape, partition layout, and acknowledgment policy used by the application. A headline throughput test without those fields is a capacity hint, not a production benchmark.
8.2Should a Kafka benchmark include cost?
Yes, if the decision includes operating economics. Keep price conversion separate from performance results, use current regional rates, and retain the resource counters that explain storage and network spend. Avoid publishing a dollar figure whose assumptions are not in the run record.
8.3How do I compare managed Kafka with self-managed Kafka?
Compare the same application contract and include the work each option leaves with the operator. Recovery, upgrades, IAM, monitoring, quotas, storage placement, and network paths belong beside throughput and latency. The right choice depends on which responsibilities your team can operate and prove.
A chart is the last artifact in a GCP Kafka benchmark, not the first. Begin with the record and recovery promise, follow the bytes through every boundary, and keep the raw evidence attached to the decision. If you want to run the same workload-shaped protocol against a Kafka-compatible Shared Storage platform, start an AutoMQ evaluation with your topology manifest and run record ready.


