
Table of Contents
Table of Contents
A topic starts with a reasonable request: give a growing event stream enough partitions for its producers and consumers. The request becomes harder when the number keeps rising even though throughput is modest. Broker memory grows, the process approaches its file descriptor limit, metadata operations take longer, and a controller event that used to be routine becomes an incident trigger.
The documented maximum for a service or deployment is a boundary, not a capacity target. Your production ceiling arrives earlier when one of the resources around the partition becomes the limiting factor. The useful question is which budget will fail first in this cluster, and how to measure it.
A practical ceiling is the smallest tested limit across broker memory, file handles, metadata scale, and controller work, with room left for a broker failure, a traffic increase, and routine operations. That framing also keeps this question separate from partition performance. More partitions can provide parallelism, but a topic can become operationally too large even when each partition carries very little traffic.
1A vendor limit is not your operating target
A service limit usually answers whether a configuration is accepted. It does not promise that topic creation, leader changes, failover, monitoring, or reassignment will stay inside your production objectives at that count. A limit may also be scoped to a cluster, a broker class, or a particular service configuration, while your problem is one topic with a particular replication factor and consumer inventory.
Start with the object count that the cluster actually has to manage. A topic with P partitions and replication factor R creates approximately P × R partition replicas. Leaders, followers, log state, monitoring series, and controller metadata are attached to those replicas or to the partitions they describe.
This is why a topic-level answer cannot be copied from a cluster-level number. Broker-local budgets depend on how replicas and leaders are distributed. Controller and metadata budgets are shared by the whole cluster, so quiet partitions can still consume control-plane attention.
More brokers can reduce per-broker replica load when placement and rebalancing work as expected, but they do not remove the metadata and controller work created by the topic. A partition performance test tells you how much traffic one partition can carry under stated conditions. It does not tell you how many partition objects the controller can coordinate during a restart or how many log files the broker can keep open.
2Four budgets decide whether the count is safe
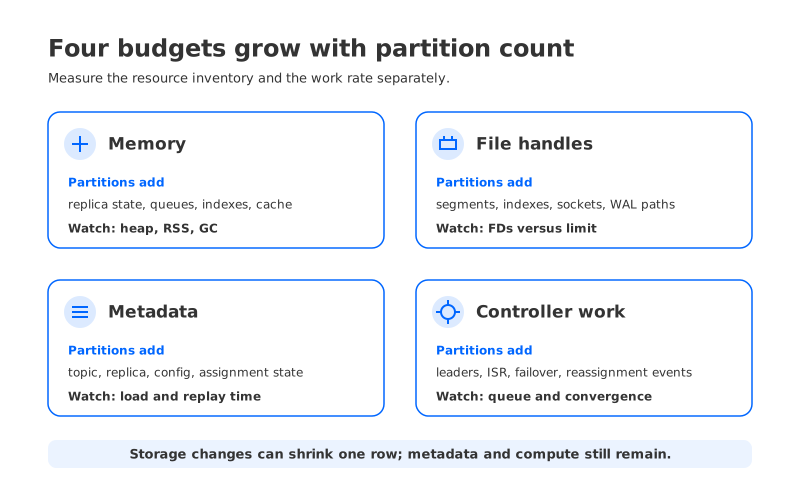
Partition overhead is easier to reason about when the budgets are kept separate. The first three are resource inventories. The fourth is the rate at which the cluster can process the changes that those inventories create.
| Budget | What partitions add | What to measure | Failure signal |
|---|---|---|---|
| Broker memory | Per-replica state, request queues, indexes, cache entries, and monitoring state | Heap, non-heap, resident memory, garbage collection, and memory per assigned replica | GC pressure, allocation stalls, or broker instability during ordinary traffic |
| File handles | Local log segments and indexes, sockets, WAL (Write-Ahead Log) or cache files, and object-storage client connections | Process file descriptors against the operating-system limit, separated by type | “Too many open files,” failed rotations, or connection errors |
| Metadata | Topic, partition, replica, configuration, and assignment records | Controller and broker metadata memory, metadata-log growth, snapshot or replay duration | Slow metadata propagation, long startup, or an oversized metadata recovery window |
| Controller work | Leader changes, ISR changes, creation, deletion, reassignment, and failure recovery events | Event queue depth, processing latency, convergence time, and controller CPU | Operations queue up or fail to converge inside the operating objective |
The memory row is broader than JVM heap. A broker may keep partition state in heap while indexes, network buffers, native allocations, page cache, WAL, or object-storage clients consume memory elsewhere. Measure the settled memory change after a representative partition increase on the target broker shape and configuration.
File handles are often mistaken for a pure storage limit. Local log segments and index files matter in a broker-local layout, but the process also needs descriptors for client sockets, inter-broker connections, monitoring, and any local write-ahead log or cache. A shared-storage design can remove a large part of the local retained-log inventory without making the operating-system limit disappear.
Metadata and controller work are related, but they are not the same measurement. Metadata is the state that must be stored, loaded, replicated, and understood. Controller work is the stream of decisions and transitions that operate on that state. A cluster may have enough memory for its metadata and still take too long to process a burst of leader elections or partition assignments.
3Turn each budget into a measured ceiling
Use a budget for each broker-local resource and a service objective for controller operations. Do not substitute a folklore “partitions per broker” number for these measurements.
For a broker with a reserved memory budget M_budget, baseline memory M_base, and measured incremental memory m_replica per assigned replica, the memory ceiling is:
P_memory = floor((M_budget - M_base) / m_replica)
For file descriptors, let F_limit be the process limit, F_base the descriptors used before the topic is added, F_safety the reserve for incidents and normal growth, and f_replica the measured incremental descriptor use:
P_handles = floor((F_limit - F_base - F_safety) / f_replica)
Every implementation can differ: segment rolling, cleanup policy, WAL choice, cache behavior, and client connections change f_replica. With shared storage, keep other descriptor categories in the baseline and test remaining local paths separately.
Metadata can use the same shape:
P_metadata = floor((M_metadata_budget - M_metadata_base) / m_metadata_per_replica)
The controller ceiling is different. Express it as the largest tested partition count for which the operations that matter to you stay inside their objectives:
P_controller = largest P where controller work stays within its SLO
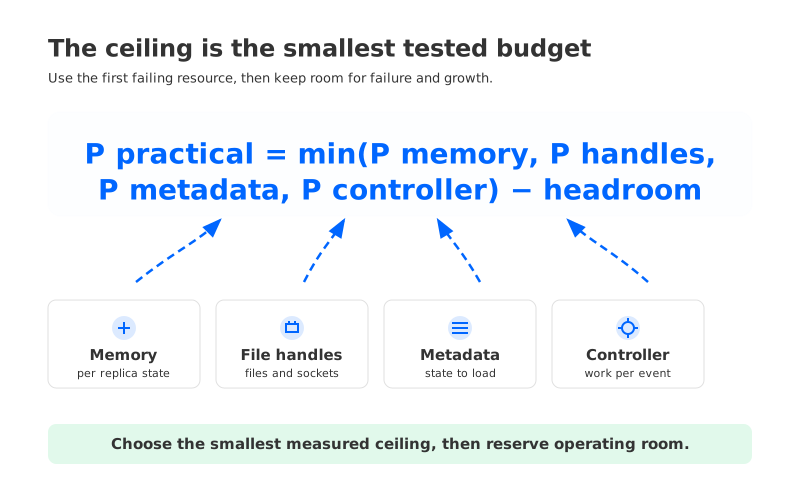
The topic ceiling is then bounded by the smallest result:
P_practical = floor(min(P_memory, P_handles, P_metadata, P_controller))
For broker-local budgets, apply the formula to the worst expected broker after replica placement, not only to the cluster total. Replication factor, broker count, leader balance, rack or Availability Zone placement, and uneven assignment all affect that worst case. Leave headroom after taking the minimum. The headroom is what keeps one failed broker, a maintenance operation, or a short traffic increase from turning the ceiling into an outage threshold.
The formulas do not replace throughput or consumer sizing. They answer a narrower question: how many partition objects can this deployment carry while its management and runtime budgets remain healthy? Keep rate and latency results beside the ceiling calculation.
4A test that finds the first failing budget
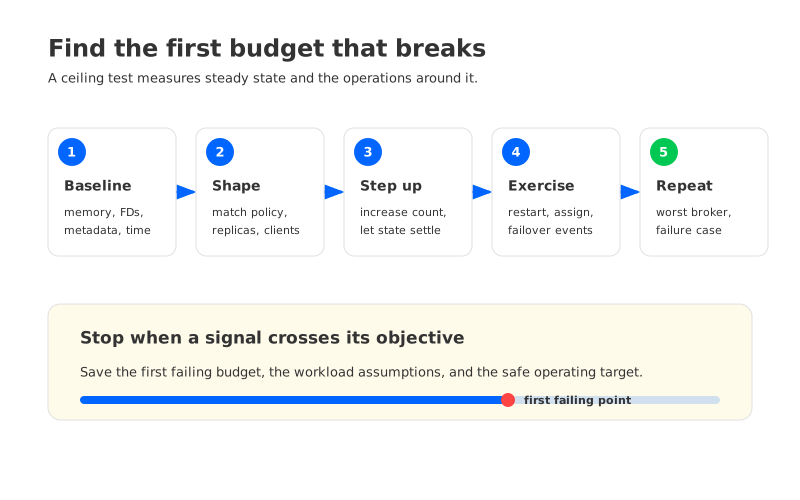
A useful ceiling test increases partitions under the production broker shape, replication factor, topic configuration, and observability. Find the first budget that misses its objective, then set the operating target below it.
Use five steps:
- Record the baseline. Capture broker memory, file descriptors by category, metadata-log and snapshot behavior, controller CPU, and the time for a normal topic operation. Record broker count, replica placement, consumer groups, and operating-system limits.
- Create a representative topic shape. Use the cleanup policy, segment settings, replication factor, key distribution, and client count that make the production topic expensive. Quiet partitions isolate object overhead; production-shaped load exposes queues, caches, and controller events.
- Increase the count in steps. Add partitions in controlled increments. After each step settles, collect the same measurements. The change between steps is more useful than one absolute reading.
- Exercise control-plane events. Create and delete test topics, restart a broker, move leadership or replicas under a controlled throttle, and observe planned recovery. Stop when an operation crosses its objective or consumes the safety reserve.
- Repeat the worst case. Test the largest expected replica load on one broker, a failed broker, a rolling restart, and the consumer groups that will attach to the topic. Save the count, first failing signal, and assumptions with the decision.
The test should produce a table that an on-call engineer can use later:
| Test point | Memory and handles | Metadata and controller | Decision |
|---|---|---|---|
| Baseline | Establish broker and process headroom | Establish normal operation time | Ready for a step |
| Candidate count | Check settled per-replica overhead | Check create, assignment, and replay behavior | Continue or hold |
| Failure case | Check worst broker after loss | Check recovery and convergence | Keep or lower the ceiling |
| Operating target | Reserve growth and maintenance room | Reserve incident and control-plane room | Use for topic policy |
This keeps the ceiling test distinct from a partition performance benchmark. A performance test asks whether the data path meets a throughput or latency target. A ceiling test asks whether the cluster can carry the objects and process transitions around them. You need both before committing to a count.
5What shared storage changes, and what it does not
In a broker-local storage model, each partition replica owns a slice of durable data, log segments, indexes, and free-space policy on a broker disk. Retention growth consumes local capacity. A broker move can require copying or rebuilding a large amount of retained data before the new placement is useful. These are storage-side constraints on top of the partition object itself.
A Shared Storage architecture changes that coupling. Durable stream data can live in shared object storage while brokers keep request-serving state, caches, metadata, and the write-ahead log or other recovery buffer required by the implementation. Partition count is no longer a direct proxy for long-lived local retained bytes or the data copied when serving ownership moves.
That is the architecture requirement a team should evaluate when local disk ownership is the first budget to fail. AutoMQ is a Kafka-compatible streaming platform built around a Shared Storage architecture. Its architecture overview describes Kafka-compatible brokers, S3Stream, WAL storage, caching, and object storage as separate parts of the data path. That separation can reduce the storage-side pressure that makes a broker-local partition count expensive.
The boundary moves; it does not vanish. Broker memory, metadata, controller work, sockets, monitoring, local cache, and object-storage clients still need capacity. A deployment using EBS WAL or NFS WAL must size that medium independently; S3 WAL has a different latency and recovery profile. The WAL storage documentation separates those choices.
Shared storage therefore changes the formula by shrinking or removing the local durable-storage term, depending on the architecture and WAL mode. It does not remove the metadata, compute, controller, cache, network, or object-storage request budgets. A topic can be too large for a Shared Storage deployment even when its retained data no longer fills a broker disk.
6The decision rule for production
Use the measured minimum as a ceiling, then choose an operating target below it. If memory is the first failing row, reduce per-partition state, change the broker shape, or reduce the topic count. If file handles fail, separate local log, WAL, cache, and network descriptors before raising the process limit. If metadata or controller work fails, reducing event churn and partition inventory may matter more than adding brokers.
Add brokers when the same partition inventory becomes safe after distribution and the controller remains within its operating objective. Add partitions when the application needs more independent work and the resulting object count still fits the four budgets. Evaluate shared storage when local durable data ownership or movement is the binding constraint. These decisions interact, but they are not interchangeable levers.
When a topic request arrives, ask for four numbers: the expected partition count, replication factor, worst-broker assignment, and the test result for controller operations at that count. If any answer is missing, the request is a capacity hypothesis, not a production limit. That small change in review language keeps “the service allows it” from becoming “the cluster can operate it.”
Return to the original question, “How many partitions is too many for one topic?” The answer is the first count at which one measured budget breaks, less the room required for normal growth and failure handling. The number belongs to your broker shape, version, storage path, and operating objectives, so the defensible ceiling is one you can reproduce in a test.
7References
- Apache Kafka documentation: topics and logs
- Apache Kafka documentation: KRaft controller
- Apache Kafka documentation: broker configurations
- Apache Kafka documentation: replication
- AutoMQ architecture overview
- AutoMQ Shared Storage architecture
- AutoMQ WAL storage
- AutoMQ compatibility with Apache Kafka
8FAQ
8.1What is the maximum number of Kafka partitions per topic?
There is no universal production maximum that applies to every Kafka deployment. A documented service limit tells you what the provider accepts. Your operating target should be the smallest tested ceiling for broker memory, file handles, metadata, and controller work, with headroom for failure and growth.
8.2Does adding brokers increase the partition limit?
It can raise per-broker memory, handle, and local storage headroom when replicas distribute well. It does not remove cluster-wide metadata or controller work, and it does not guarantee that one topic will be assigned evenly. Test the worst broker and the controller at the proposed count.
8.3Does shared storage remove Kafka partition overhead?
No. It can reduce the coupling between partition count and broker-local durable storage or data movement. Partition metadata, broker memory, controller processing, connections, caches, WAL behavior, and object-storage access still need capacity tests.
8.4How can I tell whether a topic has too many partitions?
Look for a budget that is close to its limit even when partition traffic is low: rising per-replica memory, process file descriptors, metadata recovery time, controller queue depth, or slow leader and assignment operations. Reproduce the signal with a controlled partition-count test before changing the cluster.
If local disk ownership is the budget that fails first, test a Kafka-compatible Shared Storage architecture against the same partition count and control-plane workload. Start an AutoMQ evaluation with the memory, handle, metadata, and controller measurements that produced your current ceiling.


