
Table of Contents
Table of Contents
A customer rarely opens a ticket that says UnderReplicatedPartitions is above its operating target. They say checkout events are late, a record appeared twice, or a downstream feed has stopped receiving data. By the time that message reaches the Kafka team, the customer-facing symptom is already a lagging indicator.
That gap is why a cluster can look healthy while a customer is having a bad day. Broker CPU, disk utilization, and request counts describe system activity, but they do not tell you whether a record arrived on time, produced one business action, or remained available. A useful Kafka monitoring set starts at the customer boundary, then works backward to the mechanism that can explain it.
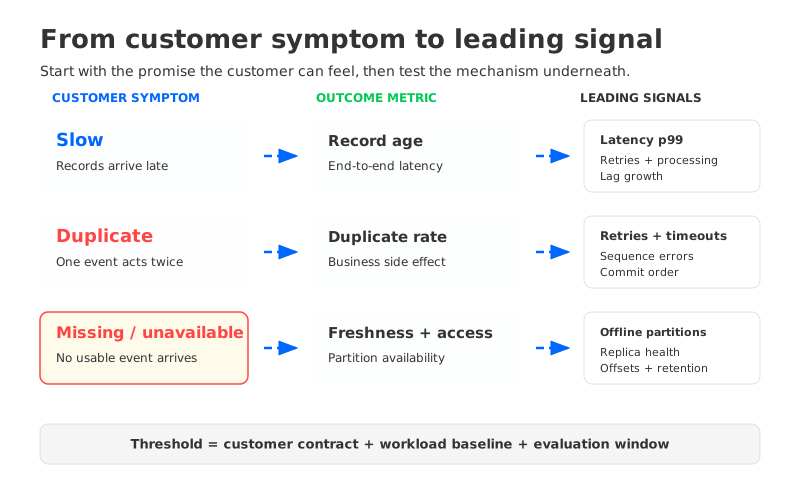
The practical model is symptom → outcome metric → leading signals → threshold → owner. Use it for three complaints that cover a large part of customer-visible Kafka trouble: slow, duplicate, and missing or unavailable records. When the storage architecture changes, keep the customer outcome and rebuild the leading-signal layer around the new write, read, and recovery paths.
1The ticket is the last signal in the chain
Component dashboards encourage a component-first response. An operator sees a broker panel, notices that most values are within range, and concludes that the platform is healthy. That conclusion is too broad. A consumer group can be late because one partition is hot, a producer can retry because a dependency is slow, or a record can look missing because the application committed before its side effect completed.
Start with two measurements that customers can recognize: record age at the business boundary and delivery outcome at the business boundary. Record age answers how long an event took to reach the consumer or downstream service. Delivery outcome answers whether the service saw one expected event, an explicit failure, or no usable event within its contract. Kafka's monitoring documentation is useful for the broker and client signals underneath those outcomes, but it does not replace an end-to-end measurement.
The second layer explains the first. It includes producer request latency and retries, consumer processing time and lag by partition, request-handler pressure, leader and replica state, and the relevant storage or network path. The third layer gives the responder scope, recent changes, a runbook, and an owner. Without that context, an alert creates a notification. With it, the alert can create a decision.
2Three symptoms, three leading-indicator chains
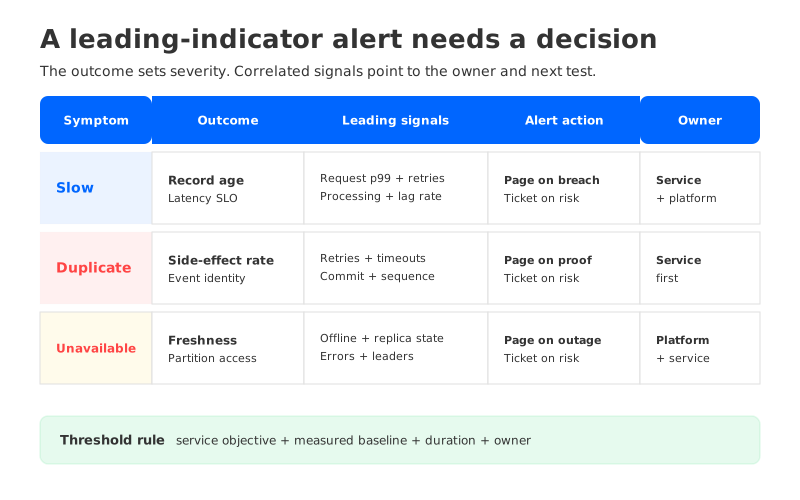
Thresholds should come from a service objective and a measured baseline, not from a number copied from another cluster. The examples below are policy shapes. Treat them as starting points, then set the duration and tolerance for each workload.
| Customer symptom | Outcome metric | Leading signals to correlate | Example alert policy | First owner |
|---|---|---|---|---|
| Records are slow | End-to-end record age or produce-to-consume latency | Produce and fetch latency, producer retries, consumer processing time, lag growth rate | Page when the outcome breaches its SLO across consecutive evaluations; open a ticket when the leading signals stay outside baseline without an outcome breach | Service team plus Kafka platform team |
| A business event is repeated | Duplicate record or duplicate side-effect rate | Producer retry and timeout rate, idempotence or sequence errors, consumer retry and commit behavior | Page when a flow with a zero-duplicate contract records a confirmed duplicate; open a ticket when retry behavior rises without a confirmed duplicate | Service owner first, platform owner when broker evidence correlates |
| Records are missing or unavailable | Produce/fetch success, record freshness, and availability of required partitions | OfflinePartitionsCount, UnderReplicatedPartitions, request errors, leader changes, retention or compaction state | Page when a required partition is unavailable or the customer contract is breached; open a ticket for sustained replication or freshness risk before the breach | Kafka platform team, with service owner for commit or filtering evidence |
The table separates what the customer experiences from what the platform can observe early. A high retry rate is a warning about delivery pressure. It becomes a customer incident when it changes the outcome or violates the flow's contract.
2.1Slow: measure age before you tune latency
“Kafka is slow” is too vague to page on. Preserve timestamps at the source, consumer, and downstream side effect, then compare end-to-end age with broker latency, producer retries, consumer processing time, and lag growth. A normal broker percentile beside a growing business age points toward the client or downstream service.
Use a two-level policy. Page when the record-age SLO is breached for the contract's allowed duration. Open a ticket when latency or retries remain above baseline long enough to threaten it. Name the slowest topic, partition, producer, or consumer group in the alert; “Kafka latency high” leaves the responder with another investigation.
Consumer lag belongs in this chain, but lag alone is not a customer-time metric. A large backlog of low-priority history can be harmless, while a small backlog on a time-sensitive topic can breach the contract. The Apache Kafka consumer configuration reference helps verify client behavior; the threshold still belongs to the workload.
2.2Duplicate: trace delivery semantics across the client boundary
A duplicate complaint needs a record identity and a business boundary. Count duplicates by a stable event ID or business key, and keep the original and repeated offsets. Correlate the counter with producer retries, timeouts, sequence or idempotence errors, and consumer retry and commit order.
Kafka's message delivery semantics define producer, consumer, and transactional behavior. They do not make an external database write, HTTP call, or payment action idempotent. Route the first investigation to the service owner when the evidence is on that boundary, then involve the platform team when request failures, leader changes, or partition availability line up with the duplicate window.
For this symptom, a zero-duplicate contract changes the severity rule. One confirmed duplicate may deserve a page even when the ratio is too small to stand out on a dashboard. A flow that permits at-least-once processing needs a different threshold and a documented deduplication path.
2.3Missing or unavailable: separate record history from partition health
“Missing” describes an observation, not a root cause. The record may not have been acknowledged, may have been filtered, may have been committed before a side effect completed, or may have been removed by retention or compaction. “Unavailable” is different: the required partition, leader, or read path cannot serve the request. Keep the branches separate.
For partition availability, correlate OfflinePartitionsCount and UnderReplicatedPartitions with produce/fetch errors and leader-change activity. For record history, capture topic, partition, offset, producer acknowledgement, consumer commit, and downstream result before changing retention or compaction. Kafka's log compaction documentation explains why older records for a key can disappear by design.
The threshold should follow the blast radius. An unavailable partition serving a critical path can be a page. A short-lived replica warning on a noncritical topic can create a ticket with an owner and deadline while freshness remains inside its objective.
3Turn an alert into a ticket with a decision attached
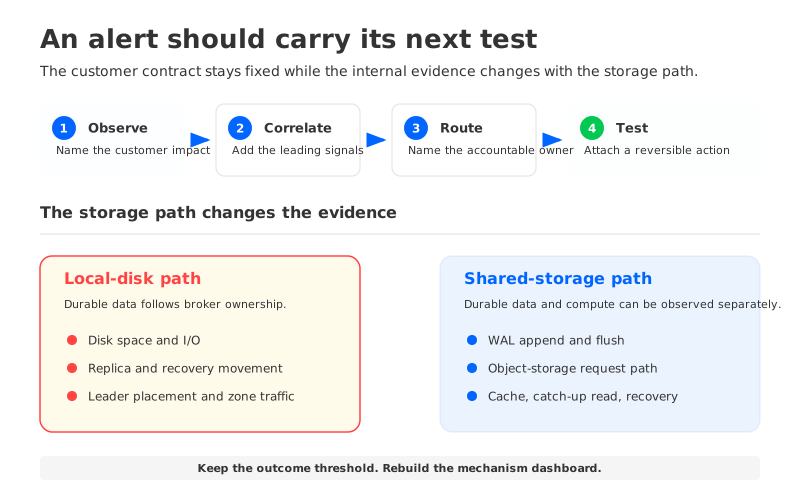
The handoff from monitoring to ticketing should preserve enough evidence for the next engineer to act without reopening every dashboard. A good alert does not try to write the postmortem. It names the customer symptom, the first mechanism to test, and the condition that changes severity.
- Observe the outcome. Record the affected topic or consumer group, customer path, first-seen time, current value, and SLO or delivery contract.
- Correlate the mechanism. Add the leading signals that moved with the symptom, plus the scope: one partition, one broker, one producer, one consumer group, or the whole cluster.
- Route the owner. Send client-bound evidence to the service team, partition and broker evidence to the Kafka platform team, and storage-path evidence to the team that owns the backing system.
- Attach the next test. Include the dashboard link, runbook, reversible first action, escalation timer, and recovery condition. A ticket without a next test becomes a queue entry rather than an incident control.
The severity policy can stay small. Page for a customer-contract breach or an unavailable required path. Create a ticket for a persistent leading risk, and record an informational event for a recovered transient signal. Keep the exact windows in the service catalog, where teams can review them with the workload owner.
4Shared storage changes the signals underneath the contract
Moving from broker-local storage to a Shared Storage architecture does not change what a customer means by “late” or “unavailable.” It changes which internal signals can explain those symptoms. A dashboard that only watches local disk utilization can lose important evidence after the data path moves, while a dashboard that preserves only broker CPU misses the new durability boundary.
In a traditional Kafka deployment, storage hypotheses often include disk space and I/O, replica health, leader placement, recovery movement, and network traffic between failure domains. Those signals describe a system where durable partition data is closely associated with broker ownership. They should not be treated as a universal checklist for every storage design.
The shared-storage view adds a different set of questions:
- Write path: Is WAL append and flush behavior within the latency baseline used for producer acknowledgement?
- Durable upload: Is data reaching object storage at the expected pace, and are request latency or errors creating a growing backlog?
- Read path: Are tailing reads served from the intended cache path, and are catch-up reads showing a separate latency or error pattern?
- Compute and coordination: Are broker request handlers, network threads, partition ownership, and metadata operations still healthy?
- Recovery: Can the team observe the data and metadata needed to replace a broker or recover a partition without guessing which copy is current?
Apache Kafka's tiered-storage design is a useful reference for separating remote log data from local storage concerns. A broader shared-storage move still needs its own tests and observability model. The test is whether each customer symptom still has a visible path from outcome to mechanism to action.
That is the boundary where AutoMQ becomes a concrete architecture to evaluate. AutoMQ is Kafka-compatible and uses S3Stream with S3-compatible object storage for durable stream data, while WAL storage and caching serve the low-latency write and read paths. Its architecture overview and WAL documentation describe the storage boundaries that the monitoring model needs to expose.
The evaluation should keep the original customer contract intact. Replay the slow path, the duplicate or retry path, the unavailable-partition path, and a historical catch-up. Compare outcomes first, then inspect the signals that explain them. AutoMQ's Prometheus metrics reference is a starting point; it does not replace instrumentation for the producer, consumer, and downstream action.
5Build the alert contract before the next ticket
For every important topic or consumer group, write down five things: the customer symptom, the outcome metric, the leading signals, the threshold duration, and the owner who can take the first reversible action. Add the dashboard and runbook links to the alert itself. Review the contract when retention, client behavior, partition shape, or storage architecture changes.
This approach keeps monitoring tied to service behavior. It also prevents an architecture migration from creating a blind spot: the contract stays stable while internal evidence changes from local disk and replica movement to WAL, object storage, cache, compute, and recovery signals.
The next time a customer says Kafka is slow, do not start by asking which broker graph is red. Ask which promise was missed, which signal moved first, and which team owns the reversible test. If the recurring answer points to broker-local storage and data movement, explore the AutoMQ project on GitHub with the same customer-facing thresholds and failure cases.
6References
- Apache Kafka monitoring
- Apache Kafka message delivery semantics
- Apache Kafka consumer configuration
- Apache Kafka log compaction
- Apache Kafka KIP-405: Tiered Storage
- Amazon MSK metrics
- Amazon MSK troubleshooting
- Kafka Monitoring That Finds Problems Before Consumers Do
- How to monitor Kafka and AutoMQ
- AutoMQ compatibility with Apache Kafka
- AutoMQ shared streaming storage
7FAQ
7.1What Kafka metrics should alert before a customer ticket?
Start with an end-to-end customer outcome such as record age, duplicate side effects, or availability of a required partition. Correlate it with the mechanism signals that can explain the change, such as request latency, retries, consumer processing time, replica health, and storage-path errors. A broker metric is an early warning only when it has a known relationship to the customer contract.
7.2How should I set Kafka alert thresholds?
Set the threshold from the service objective and a measured baseline for that workload. Define the breach duration, the affected scope, the owner, and the next reversible action. Use a page for a current contract breach, a ticket for a persistent leading risk, and an informational event for a recovered transient signal. Do not copy a threshold from a cluster with a different workload or delivery contract.
7.3Can Kafka duplicate or lose records?
Kafka delivery behavior depends on producer acknowledgement, idempotence, transactions, consumer commits, retries, retention, compaction, and the downstream side effect. A record that looks missing in a business system may have been filtered or committed before its side effect completed. Trace producer acknowledgement, topic, partition, offset, consumer commit, and downstream result before calling it a storage loss.
7.4Does shared storage remove the need for Kafka monitoring?
No. It changes the internal evidence that explains a customer outcome. Keep monitoring broker request handling, client behavior, and partition or metadata state, then add the shared-storage write, object-storage, cache, read, and recovery signals exposed by the platform. Re-baseline the alerts after the move instead of carrying local-disk thresholds forward unchanged.


