
Table of Contents
Table of Contents
In a representative incident, at 09:12 on a Monday, a platform team sees its Apache Kafka-related cloud line climbing faster than the application traffic dashboard. No service was released overnight. Broker count is unchanged, retention settings look familiar, and the Producer team says nothing changed. The useful question is narrower: which bytes, requests, or retained records changed, and which client created them?
That distinction matters because a cloud bill rarely names a Producer. It reports a service, region, operation, usage type, or network dimension. A Producer may create the first extra bytes, while replication, a replaying Consumer, or object-storage requests turn them into a larger charge. Treat "costly Producer" as an attribution hypothesis to prove against broker and client telemetry.
Use this rule: preserve the anomaly window, classify the bill line, and follow matching evidence from billing to broker to Topic to client. This finds the immediate actor without confusing a bad application setting with a structural cost multiplier.
1The bill doubles and nobody shipped anything
Freeze the comparison before anyone tunes the cluster. Record the first interval in which the cost changed, the account and region, the service and usage dimensions, and the amount that moved. A cost increase in data transfer calls for a different query from a cost increase in object requests or provisioned broker capacity. AWS Cost Explorer, or the equivalent tool in another cloud, gives the financial time window; it does not provide the client-level explanation.
Next, align that window with Kafka and infrastructure signals. Compare Producer bytes, broker request bytes, Consumer fetch bytes, Topic ingress, retained bytes, local volume use, object-storage request counts, broker count, Partition movement, replay jobs, and deployment events. Keep the comparison at the bill's granularity.
The first response should be reversible. Pause an accidental replay, throttle a confirmed client, stop an export, or restore an unintended retention setting after capturing evidence.
2Three anomaly classes: traffic, storage, requests
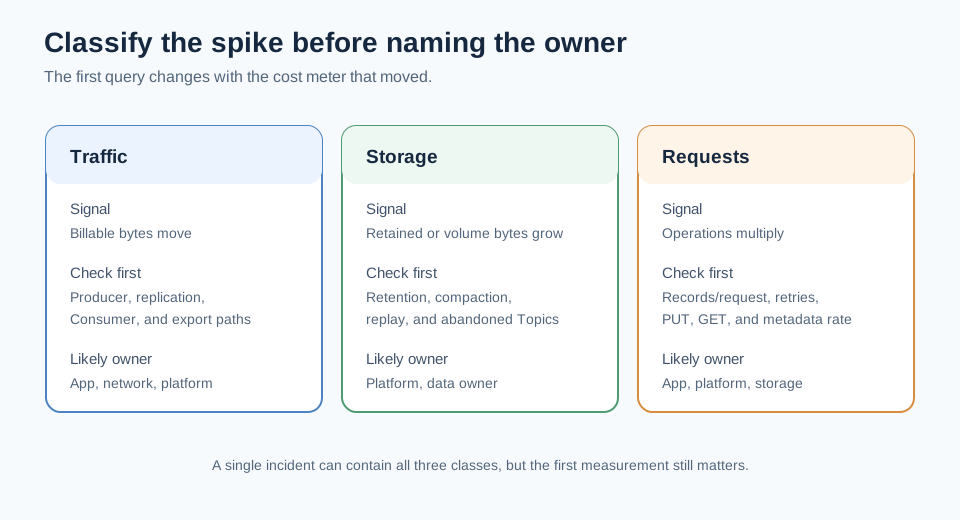
Most Kafka cost spikes become easier to reason about when the first hypothesis is one of three classes. The classes overlap in a real bill, but each has a different first measurement and a different likely owner.
| Class | What moves | First query | Common owner |
|---|---|---|---|
| Traffic | Bytes crossing a broker, zone, region, or connected service | Compare producer, replication, Consumer, and export paths by bytes | Application, network, or platform team |
| Storage | Retained bytes, local volume use, or object-storage capacity | Compare Topic retention, compaction, replay retention, and storage growth | Platform or data owner |
| Requests | Produce, fetch, metadata, PUT, GET, retry, or scan operations | Compare request count and average bytes per request | Application, platform, or storage owner |
2.1Traffic anomalies
A traffic spike can come from a Producer burst, a new Consumer group, cross-zone or cross-region placement, replication, a backfill, or an export path. Stable logical ingress does not prove stable billable traffic. A Producer may send the same payload through a new network path, or fixed ingress may be copied to followers and read again by a replay job.
Split the path into Producer-to-broker, broker-to-broker replication, broker-to-Consumer, broker-to-object-storage, and external egress. Providers differ on which side is metered and whether a private service path has its own charge. Use the current pricing page for the deployment rather than a generic per-gigabyte rate. Replication and min.insync.replicas affect durability and acknowledgment, not application attribution.
2.2Storage anomalies
Storage costs follow the retention and layout decisions that keep records available. Check retention.ms, retention.bytes, log compaction, abandoned Topics, segment deletion, local disk headroom, and any object-storage tier. A Consumer behind the log end does not by itself prevent cleanup, but it can correlate with replay or an unexpectedly long retention policy. Confirm the settings in Kafka's Topic configuration reference.
Do not allocate all retained storage to the latest Producer. If several Producers share a Topic, name the Topic, policy, and time range first, then assign a Producer share only when record and key distribution support it.
2.3Request anomalies
Requests expose a different failure mode: the same logical bytes can be carried in efficient batches or many small operations. A Producer that stops batching may leave logical throughput unchanged while increasing request count, protocol overhead, broker work, retries, and downstream object operations. Small historical reads can create a similar pattern on the Consumer side.
For request analysis, track records per Produce request, compressed bytes per request, average record size, retry rate, metadata request rate, and object PUT or GET counts where those metrics are available. The cost owner may be the Producer, a replay tool, or a storage policy. The request count tells you which path changed; it does not, on its own, tell you which application team should fix it.
3From bill to broker to client: the tracing path
Narrow one dimension at a time: start at the bill, find the broker and Topic with the same shape, then identify the client that owns the changed requests. This prevents jumping from a large Topic to the assumption that its newest Producer is at fault.
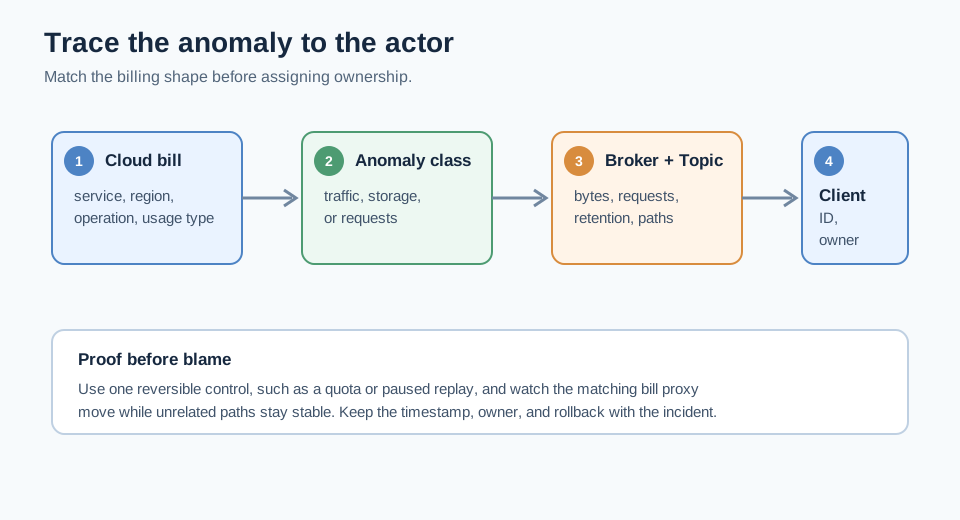
Step 1: establish the billable boundary. Filter the billing export to the account, region, service, operation, and usage type that changed. Mark whether it represents capacity, stored bytes, requests, data transfer, retrieval, or an external service. For network charges, record both endpoints and their zones or regions. "Kafka traffic" is too broad to guide a query.
Step 2: match the shape at the broker. Compare Produce and Fetch rate, bytes in and out, connection count, Partition distribution, and throttling with the same window. A broker-level jump with stable client ingress may indicate replication, recovery, or Consumer traffic; a jump on one connection group is more consistent with a client change. Kafka's monitoring documentation covers the relevant metric scope.
Step 3: narrow to Topic and Partition. Rank Topics by ingress, egress, retained bytes, and request count, then check whether a new Partition, assignment, retention change, or replay explains the shape. A large Topic can hide multiple client behaviors, so use it as an intermediate join, not the final owner.
Step 4: identify the client with more than an IP address. Join client.id or equivalent metrics to principal, deployment, source address, and application labels. Shared IDs, connection pooling, and NAT can make an IP-based answer misleading. If identity is missing, add it to the next measurement and use current evidence only for a bounded mitigation.
Step 5: preserve a reversible proof. Apply a quota or temporary throttle to the candidate client, or pause the replay job, and watch the matching bill proxy while unrelated paths stay stable. Use the smallest control that changes one variable and has an owner, rollback, and expiry time.
4Case study: the Producer that forgot to batch
Consider a representative incident. A telemetry Producer is upgraded to a code path that flushes each small Record immediately. Event volume remains normal, but average compressed bytes per Produce request falls sharply. The billing line rises later, after broker, network, and object-storage paths process many more operations.
The team tests the hypothesis with a before-and-after worksheet. Let E be records per second, S the average compressed record size, and B the average compressed bytes per request:
produce requests per second = E x S / B
If E and S stay stable while B falls, request rate rises in the same proportion. That does not produce the same increase in every bill line: network billing may follow bytes, request billing may follow operation count, and broker compute may follow both. The formula is a diagnostic bridge, not a price quote.
The team then checks four signals in the same interval:
- Batching:
batch.size,linger.ms, records per request, and compressed bytes per request. The Apache Kafka Producer configuration reference defines the client-side controls, but the observed request profile is the evidence for this incident. - Retries: retry rate, timeout rate, and error responses. Retries can add work and traffic, but the additional billable direction depends on the service path.
- Client identity: producer ID, principal, deployment version, and source location. The deployment change is a lead, not proof, until its time series matches the anomaly.
- Downstream work: broker request rate, local flush or WAL activity, object PUTs, and any cross-zone path. This shows which costs were actually amplified.
If the client needs protection, apply a Kafka quota with an owner and expiry. A quota controls rate; it does not explain the original billing path.
The mitigation is to restore batching, observe the bill proxy, and decide whether a quota should remain. Cross-zone Producer placement and broker replication still need separate checks. A client fix can reduce the trigger without removing the architecture that magnifies it.
5Derive the architecture requirement before choosing a fix
The investigation ends with two decisions. One is operational: fix the Producer, replay job, retention policy, or placement. The other is architectural: decide whether the storage and replication model makes ordinary client actions expensive to trace and control.
The neutral test is a set of requirements, not a feature list. The candidate must preserve the Kafka protocol and delivery semantics applications depend on, make durable ownership visible, keep client identity available, and show which storage and network paths remain billable. To remove broker-replication traffic, the durable stream needs a shared owner reachable by brokers rather than a long-term copy on every broker.
That requirement is where AutoMQ fits: a Kafka-compatible cloud-native stream platform built around a Shared Storage architecture. Its brokers handle Kafka requests and compute, while S3Stream uses a configured WAL (Write-Ahead Log) layer and S3 storage for the persistent stream. The architecture overview and Shared Storage documentation describe the boundary. In an AutoMQ BYOC (Bring Your Own Cloud) deployment, the control and data planes run in the customer's VPC, so the same client, object-storage, and network ledger still applies inside that environment.
The cost implication is specific. In an eligible shared-storage deployment, the broker-to-broker replication leg that crosses Availability Zones can be removed. A Producer's inefficient behavior is then easier to attribute because it is less likely to be multiplied through follower copies. Consumer reads, cross-region egress, object-storage requests, retrieval, and other network paths remain. Read AutoMQ's zero cross-AZ traffic guidance with the deployment and storage boundary in mind.
WAL is a boundary, not a synonym for the full storage bill. The WAL choice affects write latency, durability placement, and cost, while S3 storage holds longer-lived stream data. Name whether the review covers S3 WAL, Regional EBS WAL, or NFS WAL, and keep object requests and data transfer in the ledger. Kafka compatibility reduces application change; it does not remove the measurements.
6Alarms and a monthly watchlist
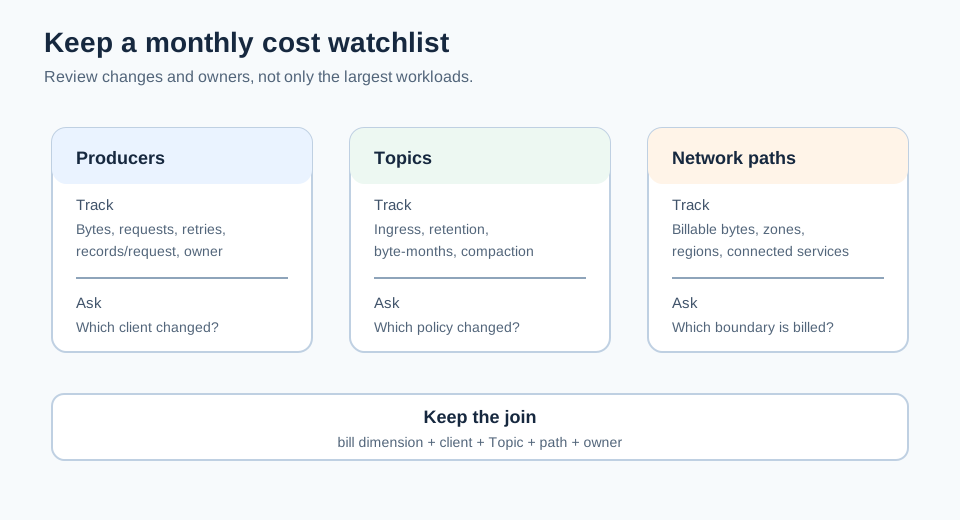
An anomaly runbook works best when the first query already has the dimensions needed for attribution. Alert on a change from each workload's baseline rather than one global number for every Topic. Record the current value, baseline window, owner, suspected class, and bill dimension it should influence.
Use separate alert families for:
- Producer and Consumer bytes by client, Topic, zone, and region;
- Produce, Fetch, metadata, retry, and throttle rates;
- records per request, compressed bytes per request, and average record size;
- retained bytes, local volume use, retention changes, compaction backlog, and object PUT or GET counts;
- new client identities, new Consumer groups, replay jobs, Partition movement, and cross-zone or cross-region paths.
For each alert, define a response window and reversible action. A request-rate anomaly needs a client owner; a retained-byte anomaly needs a Topic policy owner; a network anomaly needs endpoints and the provider billing rule. A dashboard that reports only "Kafka cost" cannot route those actions.
7References
- Apache Kafka design and replication
- Apache Kafka monitoring
- Apache Kafka Producer configurations
- Apache Kafka Topic configurations
- Apache Kafka quotas
- KIP-405: Kafka Tiered Storage
- AWS Cost Explorer
- Amazon VPC Flow Logs
- Amazon EC2 on-demand pricing and data transfer
- Amazon S3 pricing
- AutoMQ Kafka compatibility
8FAQ
8.1What should I check first when the Kafka bill suddenly rises?
Identify the first changed billing dimension and its timestamp, then compare that window with Producer bytes, Consumer bytes, retained bytes, request counts, retries, broker capacity, and replay activity. Preserve the evidence before changing settings.
8.2How can I find the Producer causing the cost spike?
Use the changed bill dimension to choose the matching broker metric, rank Topics, and join the winning path to client.id, principal, deployment, and source location. A Producer is a credible owner only when its time series matches the anomaly and the downstream path explains the bill.
8.3Can batching alone fix a Kafka traffic audit finding?
Batching can reduce request overhead and broker work when a client is sending many small requests. It cannot remove cross-zone placement, broker replication, replay, retention, or external egress costs. Measure which path changed before treating it as the whole fix.
8.4Does a Shared Storage architecture eliminate every Kafka network charge?
No. It can remove a broker-to-broker replication path in an eligible deployment, but client traffic, object-storage access, cross-region movement, external egress, and provider-specific network charges still need to be measured.
8.5What should a monthly Kafka cost dashboard retain?
Keep the bill dimension, Producer and Consumer identity, Topic, zone and region, bytes, request counts, retained bytes, retry rate, and the relevant owner. Trends and changes are more useful than a static top list.
When the next bill arrives, start with the line that changed, not the team that is easiest to blame. If the evidence points to a replication or storage boundary that your current architecture keeps multiplying, run the same workload and attribution checks with AutoMQ. The goal is a bill you can explain from client behavior to infrastructure path, with no unexplained jump between the two.


