
Table of Contents
Table of Contents
Most Amazon MSK monitoring dashboards answer the first operational question well: is the Kafka cluster alive? Broker count, CPU, disk, request latency, and consumer lag expose immediate health risks. The harder question is whether the cluster is quietly becoming too expensive, too hard to scale, or too dependent on local storage behavior.
That distinction matters because Amazon MSK runs Apache Kafka with managed control-plane operations, but the workload physics are still Kafka physics. Brokers serve client traffic, replicate data, retain logs on attached storage, move partitions during rebalancing, and expose metrics through Amazon CloudWatch and Kafka-compatible interfaces. AWS documents MSK metrics across monitoring levels such as DEFAULT, PER_BROKER, PER_TOPIC_PER_BROKER, and PER_TOPIC_PER_PARTITION, and Apache Kafka documents the underlying JMX metric model used by operators for broker, topic, request, controller, and replica health.
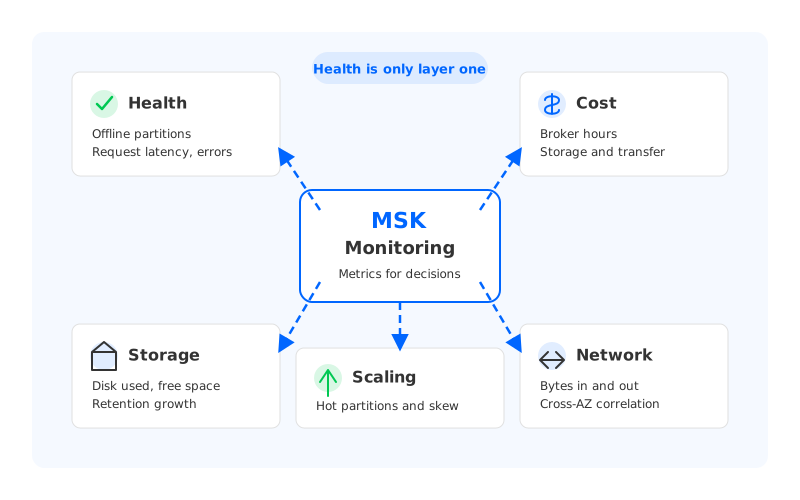
Good MSK monitoring therefore needs three layers: Kafka health metrics for service safety, cost and capacity signals for FinOps, and architecture-readiness signals that show when the local-disk Kafka model itself is becoming the constraint.
1What Amazon MSK Monitoring Should Answer
The useful mental model is not "which metric should alert?" but "which decision does this metric support?" Incident response, capacity planning, cost attribution, and scaling readiness need different views. A healthy cluster average can still hide one broker carrying a hot partition.
An MSK monitoring model should answer five questions:
- Is the cluster available for producers and consumers? Watch broker count, offline partitions, under-replicated partitions, request errors, request latency, and consumer lag.
- Is workload growth consuming the right resource? Throughput can be limited by CPU, network, disk throughput, disk capacity, partition count, request rate, or client behavior. The metric group should show which one is moving first.
- Is the bill explainable? MSK cost is not a single line item. It includes broker instance hours, storage, storage throughput when configured, data transfer, and related observability or networking services.
- Is scaling safe? A cluster can have spare average CPU while one broker or partition is hot. Scaling risk appears in imbalance, replication pressure, request latency, and partition movement side effects.
- Is the architecture still a good fit? When most operational work becomes storage expansion, rebalancing, cross-AZ traffic analysis, and cold-read protection, the monitoring data is telling you something larger than "add another broker."
AWS gives the raw material through MSK and CloudWatch metrics. Kafka gives the semantic model behind many of them. Cost attribution often requires joining those metrics with AWS Cost and Usage Reports, VPC Flow Logs, and data transfer pricing.
2Core Kafka Health Metrics
Health metrics should stay boring. They are the first panel on the wall because they protect availability, not because they explain the whole platform. AWS MSK exposes cluster, broker, topic, and partition metrics through CloudWatch, while Kafka exposes equivalent and deeper signals through JMX.
| Monitoring question | Metric examples |
|---|---|
| Are partitions serving traffic? | OfflinePartitionsCount, active controller count, leader counts |
| Are replicas keeping up? | UnderReplicatedPartitions, ISR-related Kafka JMX metrics |
| Are clients waiting? | Produce/fetch request latency, request queue time, request handler idle percentage |
| Are consumers falling behind? | Consumer lag by group and topic |
| Are brokers uneven? | Per-broker bytes in/out, partitions, CPU, disk, connection count |
None of these metrics has a universal threshold. Baseline each metric by workload class, topic, and time window, then alert on service-level violations or sharp peer divergence.
Broker-to-broker comparison is especially important. A cluster-level graph can look calm while one broker is constrained by a hot leader, uneven partition placement, or a bursty client group. Per-broker visibility is the difference between "MSK is slow" and "broker 3 is carrying the changed topic."
3Metrics That Expose Cost Drivers
MSK pricing starts with broker instance hours, but the bill does not stop there. AWS lists separate MSK pricing dimensions for broker instances, storage, provisioned storage throughput where applicable, and data transfer. Monitoring has to connect technical counters to billable resources rather than treating cost as a monthly surprise.
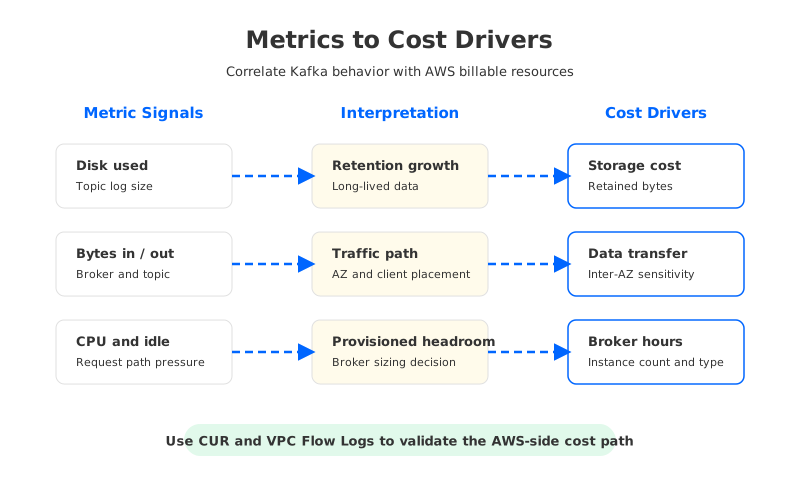
The most useful cost dashboard is an engineering dashboard with enough billing context to explain why the bill moved. It groups Kafka and AWS signals into storage, network, and broker-utilization stories.
3.1Disk and Retention Pressure
Kafka retention turns time into storage. If write throughput rises and retention stays constant, storage grows predictably. In MSK, metrics such as data log disk used, free storage space, and per-topic bytes in help show whether storage growth comes from valid retention needs or workload drift.
The expensive failure mode is not always running out of disk. It is reserving storage and broker capacity around peak retained bytes because the cluster cannot separate compute from local data ownership. Long retention, large partitions, and uneven topic growth increase the blast radius of rebalancing and broker replacement.
Two views help here: topic-level retained bytes, and broker-level storage skew. Together they show whether storage growth is a product requirement, a forgotten retention policy, or an imbalance that will complicate scaling.
3.2Network and Cross-AZ Traffic
Kafka traffic is easy to undercount because client bytes are not the whole story. A replicated MSK topic generates producer ingress, consumer egress, and broker-to-broker replication. In a multi-AZ deployment, part of that traffic can cross Availability Zone boundaries depending on broker placement, partition leadership, replica placement, and client location.
MSK metrics show bytes in and bytes out by broker or topic, but cost attribution usually needs AWS-side data. VPC Flow Logs can capture IP traffic metadata for network interfaces, and AWS Cost and Usage Reports provide detailed cost and usage records. For FinOps, the key is correlation: match Kafka throughput patterns with data transfer usage types and network paths instead of assuming all throughput has the same cost profile.
This is where a "healthy" Kafka dashboard can be misleading. Producer latency may be fine and consumer lag may be flat while the bill rises because fan-out, replication, or client placement changed. Cross-AZ-sensitive traffic deserves first-class visibility.
3.3Broker Utilization
Broker utilization is where cost and scaling meet. Low average CPU does not automatically mean overprovisioning, because Kafka can be constrained by network, disk, request queues, or hot partitions. High CPU does not automatically mean you need more brokers, because compression, TLS, and request mix can move CPU independently of total throughput.
A useful utilization dashboard combines CPU, network, and disk throughput per broker with Kafka request handler idle, network processor idle, produce/fetch latency, partition distribution, leader distribution, and byte distribution. Utilization only matters operationally when it reaches clients or concentrates risk on one broker.
For CTOs and FinOps teams, the outcome is knowing whether broker count is driven by compute, storage, network, replication, or operational risk. Those are different decisions.
4Metrics That Indicate Scaling Risk
Scaling an MSK cluster is not the same as scaling a stateless service. Kafka brokers own partition replicas stored on local volumes. Adding brokers can increase available compute and storage, but the cluster still needs partition reassignment to move data and leaders.
The monitoring signals that deserve attention before a scaling event are the ones that show how expensive movement will be:
| Scaling risk | Metric pattern to inspect |
|---|---|
| Hot partitions | Per-partition bytes, leader skew, per-broker bytes |
| Large retained partitions | Topic log size, partition size distribution, disk used |
| Replica pressure | Under-replicated partitions, replication latency, broker network |
| Client sensitivity | Produce/fetch latency and consumer lag during maintenance windows |
| Storage headroom | Free storage and disk usage trend by broker |
The important pattern is the combination: large retained partitions, uneven leader placement, high broker network, and rising request latency during maintenance-like activity. That combination says the cluster can scale, but scaling is not operationally neutral.
For data engineering teams, consumer lag adds another dimension. A lag spike after a producer burst is not always a consumer problem. Pair lag with fetch latency, bytes out, and downstream metrics before assigning blame to the consumer group.
5Storage Problems Show Up Before Disk Is Full
Storage incidents often announce themselves earlier than the final free-space graph. They appear as latency during cold reads, longer reassignment windows, stubborn broker imbalance, or throughput throttling.
The pattern to watch is storage coupling. Kafka's local log design means the broker is both a compute node and a storage owner. That coupling becomes harder when retention grows faster than compute needs, consumers frequently read older data, or scaling events require moving large historical logs.
At that point, monitoring should stop asking only "which broker needs more disk?" and start asking "why does this compute scaling decision require so much data movement?" That question is not anti-MSK. It is the architectural question monitoring is supposed to surface.
6When Monitoring Becomes Migration Readiness Data
The right time to evaluate a different Kafka architecture is when monitoring shows the same operational constraint repeating across capacity reviews. A few patterns are especially telling:
- Broker count is driven by retained bytes rather than request processing. The cluster needs more nodes because data lives on brokers, not because clients need more compute.
- Reassignment work is treated as a risky production event. Teams schedule around it, throttle it, and still watch latency and lag carefully.
- Cross-AZ traffic analysis keeps returning to Kafka replication and client placement. The technical graph and the cost graph are explaining the same issue.
- Cold reads or catch-up consumers disturb write latency. Historical data is competing with the hot path.
- Storage skew, partition skew, and leader skew consume more planning time than application-level reliability work.
Those signals do not prove that a team must leave MSK. They prove that monitoring data should be part of a broader architecture review. For some teams, tuning partitioning, retention, client placement, and broker sizing is enough. For others, the repeated constraint is the local-storage broker model itself.
7What AutoMQ Adds to Kafka Observability
Once the root issue is compute-storage coupling, the monitoring surface changes. A shared-storage Kafka-compatible architecture keeps Kafka protocol and client semantics, but moves durable log storage away from broker-local disks. AutoMQ is in this category: it is Kafka-compatible and uses S3Stream to place stream data on S3-compatible object storage, with WAL storage in the write path for durable acknowledgment.
That architecture does not remove the need for Kafka monitoring. It changes what else you can see. AutoMQ exposes native Kafka metrics and additional system metrics through Prometheus-compatible integrations, including S3Stream, object storage, WAL, cache, broker, topic, group, and controller dimensions. Its documentation also describes CloudWatch and Prometheus integration paths for teams that want to keep their existing observability stack.
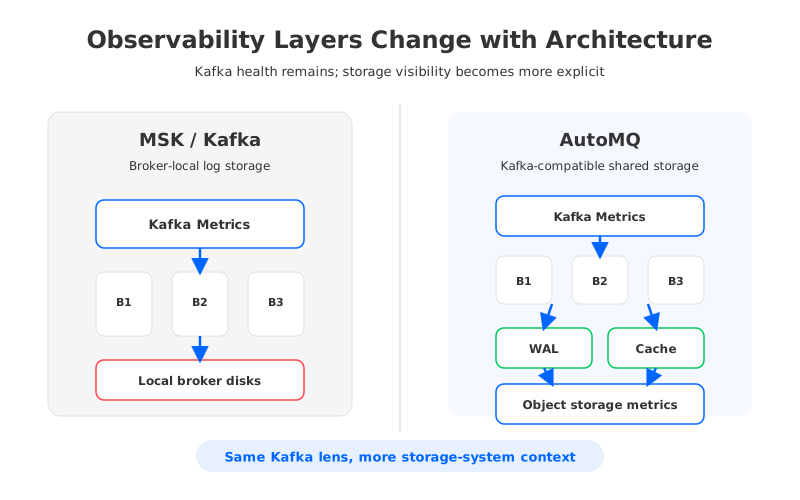
The practical difference is that storage questions become more explicit. Instead of inferring storage behavior mostly from broker disk and reassignment side effects, operators can observe object count, object size, stream object distribution, WAL behavior, cache behavior, and Kafka traffic together.
If your MSK monitoring shows healthy cost, predictable scaling, balanced storage, and acceptable operational work, the managed Kafka model may be serving you well. If the same metrics keep pointing to storage movement, cross-AZ replication cost, and broker-local capacity planning, a shared-storage design gives you a different set of levers.
8A Practical MSK Monitoring Dashboard Layout
A high-signal MSK dashboard should be organized by decision, not by metric namespace. Put service health first: offline partitions, under-replicated partitions, request latency, request errors, and consumer lag. Put broker pressure next: CPU, network, disk throughput, request handler idle, and connection count. Then add storage posture, traffic cost, and scaling readiness.
Do not hide behind averages. Use cluster-level graphs for executives and incident overview, but keep per-broker and per-topic drill-downs one click away. Kafka problems often begin as distribution problems.
9References
- AWS, Monitoring an Amazon MSK cluster
- AWS, Amazon MSK metrics for monitoring with CloudWatch
- AWS, Amazon MSK pricing
- AWS, Amazon EC2 On-Demand Pricing: Data Transfer
- AWS, VPC Flow Logs
- AWS, AWS Cost and Usage Reports User Guide
- Apache Kafka, Monitoring
- AutoMQ Docs, Observability overview
- AutoMQ Docs, Prometheus metrics
- AutoMQ Docs, WAL storage
10FAQ
10.1What is the most important Amazon MSK monitoring metric?
There is no single most important metric. For availability, start with offline partitions, under-replicated partitions, request latency, request errors, and consumer lag. For cost and scaling, add disk usage, bytes in/out, broker utilization, leader distribution, partition size, and AWS billing or network-flow data.
10.2Can CloudWatch metrics explain MSK cost by themselves?
CloudWatch metrics explain broker pressure, storage growth, and traffic volume. Join them with AWS pricing, Cost and Usage Reports, and sometimes VPC Flow Logs to explain the bill by transfer path, usage type, and workload owner.
10.3Which MSK metrics reveal storage pressure?
Disk used, free storage, topic log size, partition size distribution, bytes in, and retention growth are the starting points. Also watch reassignment duration, latency during catch-up reads, and broker skew.
10.4How should teams monitor cross-AZ traffic for MSK?
Start with MSK bytes in/out by broker and topic, then correlate traffic with VPC Flow Logs and AWS Cost and Usage Reports. The goal is to identify which producers, consumers, replication paths, or client placements are associated with inter-AZ data transfer charges.
10.5When should MSK monitoring lead to an architecture review?
An architecture review is useful when broker count is driven by retained data rather than compute, reassignment becomes a risky production operation, cross-AZ traffic dominates cost analysis, or cold reads disturb the hot path.
10.6How is AutoMQ monitoring different from MSK monitoring?
MSK monitoring focuses on managed Kafka brokers, Kafka metrics, and AWS infrastructure metrics. AutoMQ keeps Kafka-compatible metrics but adds visibility into shared-storage components such as S3Stream, object storage, WAL, cache, and self-balancing related behavior.
If your MSK dashboards already explain cost, scaling, and storage clearly, keep improving them. If they keep pointing to the same storage-coupled bottleneck, review a shared-storage Kafka-compatible architecture such as AutoMQ and validate it against your own traffic, retention, latency, and cost data. Start with the AutoMQ documentation at go.automq.com and compare the observability model with the constraints your MSK metrics are already showing.


