
Table of Contents
Table of Contents
At 2 a.m., an under-replicated partition alert is often misread. The dashboard says UnderReplicatedPartitions > 0, a broker may be flapping, and the first instinct is often to restart more things or force a leader election. That can turn a contained replica-lag event into a wider availability problem.
The useful interpretation is narrower: Kafka's redundancy contract is temporarily incomplete. One or more partitions have fewer in-sync replicas (ISR) than their configured replication factor. The alert does not, by itself, tell you whether records are being lost, whether producers are blocked, or whether a follower is about to catch up. Those are separate questions, and the order in which you answer them matters.
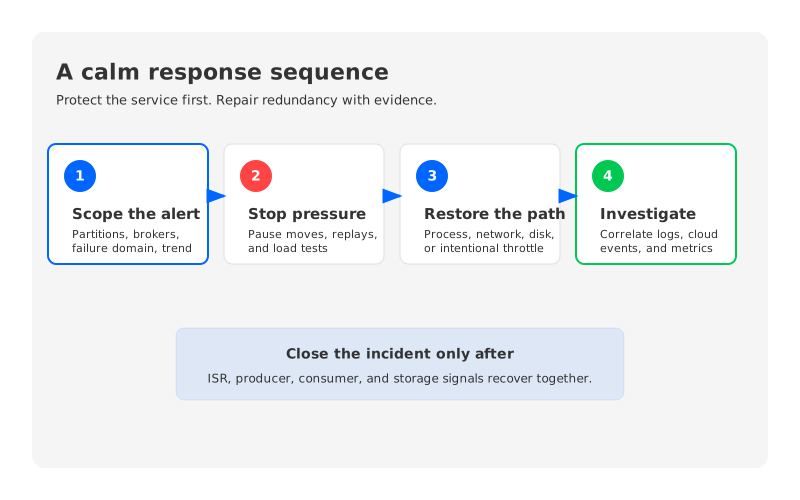
This field guide uses a simple sequence: establish scope, stop adding pressure, restore replica health, then investigate the cause. The checks are designed to preserve evidence while the cluster is still serving traffic.
1What the alert actually says
In a traditional Apache Kafka cluster, a partition has a replication factor and a set of replicas that are currently in sync with the leader. The ISR is the subset that has satisfied Kafka's replication criteria. A partition becomes under-replicated when the ISR is smaller than the full replica set. For a topic with a replication factor of three, an ISR of two means the partition is under-replicated even if both remaining replicas are serving reads and writes.
That distinction is operationally important. URP is a redundancy signal, not a complete service-health score. A single partition with one follower briefly behind has a different risk profile from thousands of partitions losing the same rack. The first task is therefore to turn a count into a shape:
- Which topics and partitions are affected?
- Is one broker present in most affected replica sets?
- Are the affected brokers in one Availability Zone (AZ), rack, or network path?
- Is the ISR shrinking, stable, or recovering?
- Are producers seeing failed acknowledgments, retries, or timeouts?
- Are consumers seeing lag, fetch errors, or only a replication alert?
Use the topic description and broker metrics to answer those questions before changing cluster state. A typical first inspection is:
kafka-topics.sh \
  --bootstrap-server "$BOOTSTRAP" \
  --describe \
  --topic "$TOPIC"
Capture the output, alert timestamp, broker logs, controller events, and affected topic configuration. The exact command path varies by distribution, but preserve the leader, replica set, ISR, offline partitions, request errors, disk or storage pressure, and network health.
min.insync.replicas is part of the same conversation, but it answers a different question. It limits how many ISR members must be available for writes that use a sufficiently strong acknowledgment mode. It does not make a lagging follower catch up, and changing it during an incident can trade write availability for a weaker durability contract. Treat it as a declared service policy, not a midnight repair switch.
The same caution applies to unclean leader election. Allowing a replica that is not in the ISR to become leader can restore a leader when all clean replicas are unavailable, but it can also discard records that existed only on the failed leader. That is a business and data-integrity decision. It should be an explicitly approved last resort, not the default response to a red dashboard.
2URP semantics in thirty seconds
The state transition is easier to reason about than the alert name suggests. The leader accepts writes and followers fetch them. When a follower falls far enough behind, Kafka removes it from the ISR. The full replica set is still recorded in the partition metadata, but the set currently trusted for clean failover is smaller.
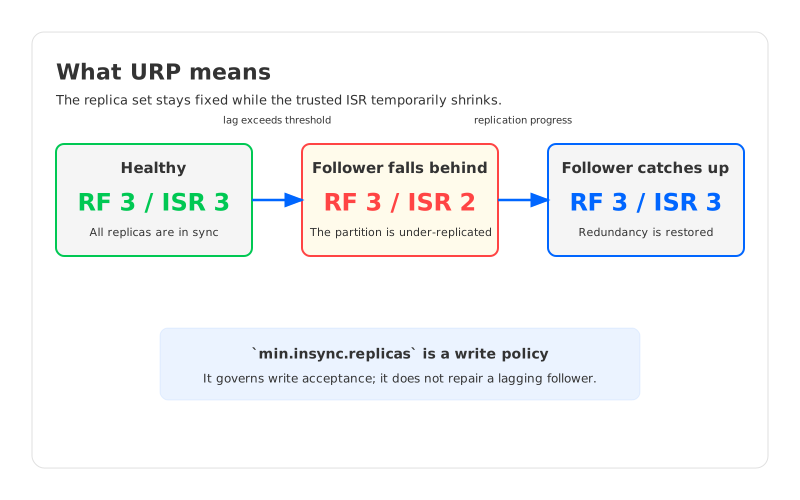
The recovery target is not to make the number green through any available action. It is to restore a healthy ISR without causing the leader or remaining followers to fail. Distinguish a slow follower from an unreachable one, and an overloaded broker from one losing its storage path.
Three measurements make the transition visible:
- ISR membership: whether the follower is still in the ISR, and whether the set is changing.
- Replication progress: follower fetch rate, bytes remaining, request latency, and throttling state.
- Application impact: producer acknowledgment errors, consumer fetch errors, consumer lag, and end-to-end freshness.
The alert clears when the replica returns to the ISR, but the incident is not necessarily over at that instant. A broker can rejoin while disk latency, network retransmits, controller churn, or client retries remain elevated. Keep the recovery window open until the underlying pressure and application symptoms have returned to their agreed baseline.
3Three failure shapes and their severity
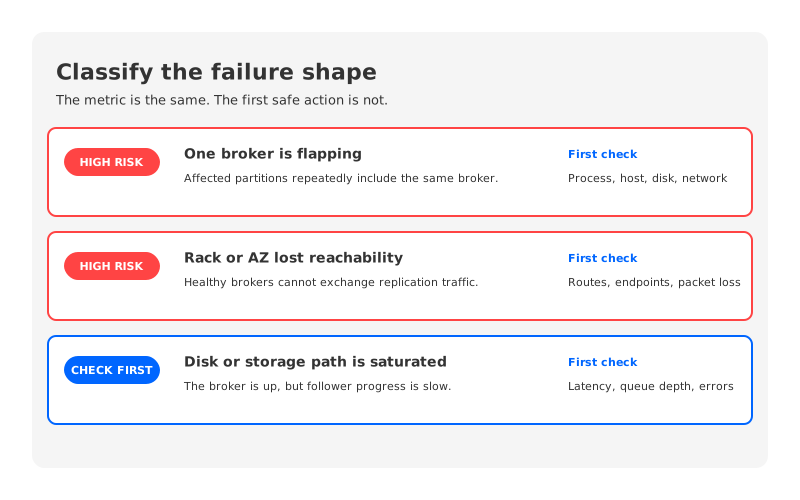
URP response becomes faster when the first classification is about failure shape rather than product component. The same metric can come from a process restart, a failed network path, or a saturated disk, and each calls for a different next action.
3.1A single broker is flapping
If most affected partitions include one broker and that broker repeatedly leaves and rejoins, treat it as an unstable member. Repeated restarts may create more leader movement and connection churn without addressing the cause. Check process exit logs, heap or file-descriptor pressure, CPU throttling, disk latency, kernel or host events, and the broker's network path.
If the broker is healthy enough to serve but not healthy enough to replicate, isolate the decision from the repair. A controlled drain or removal may be safer, but only after confirming that the remaining ISR and write policy can carry the workload. Confirm how many partitions depend on it and whether it is the only in-sync copy for any critical topic.
3.2A rack or AZ has lost reachability
When affected replicas cluster by rack, subnet, or AZ, the broker process may be innocent. Check security-group changes, route tables, load balancer or endpoint health, DNS, packet loss, and the cloud provider's infrastructure events. A network partition can make a healthy follower look like a failed disk, and restarting it will not repair the path.
The urgent concern is whether leaders and clean replicas still span the intended failure domains. If the cluster is writing successfully but the surviving ISR is concentrated in one location, the alert may be an early warning for a second failure. Preserve placement evidence before reassigning partitions or changing rack-awareness settings.
3.3A disk or storage path is saturated
A follower can fall out of the ISR because it cannot read or write fast enough, even though the broker process is up. Look for disk queue depth, filesystem errors, volume throughput limits, controller latency, page-cache pressure, and a concurrent retention, compaction, replay, or reassignment job. A full disk is obvious; rising latency before the disk fills is easier to miss.
The safe action is to remove competing work and restore a predictable replication path. Pause planned movements, reduce nonessential replay or compaction pressure where policy allows it, and confirm that any replication throttle is intentional and visible. Avoid a global throttle without checking the affected topics. A setting that protects one hot partition can prolong recovery for hundreds of smaller ones.
4Stop the bleed, then heal, then investigate
The following order is deliberately less dramatic than a full cluster restart. It preserves the option to make a more invasive change after the evidence is clear.
4.1Establish whether the alert is growing
Record the current URP count and the list of affected partitions. Compare it with the previous few alert intervals. Then check offline partitions, active controller changes, leader elections, producer errors, consumer lag, and storage or network saturation. A rising URP count with failed writes is an availability incident. A small, stable count with healthy application traffic may be a recovery incident that still needs attention but does not justify broad disruption.
Mark the scope in operational terms: critical topics, total partitions, brokers involved, and failure domain. A topic-level view is more useful than a cluster-wide red number because it tells the incident lead which traffic is at risk and which changes are safe to defer.
4.2Remove avoidable pressure
Stop scheduled maintenance, partition reassignment, ad hoc replay, and load tests that are competing with replica catch-up. Keep the producer and consumer paths running unless the service owner has an explicit reason to shed traffic. Do not delete topics, lower replication factor, or change retention as an improvised fix for a replica-health alert.
If one broker is clearly unstable, decide whether to isolate it based on the remaining ISR, min.insync.replicas, client acknowledgment behavior, and topic criticality. The question is which action leaves the cleanest failure path if the next broker also has trouble.
4.3Restore the replication path
Repair the dependency that is actually limiting follower progress: bring the process back only when its host and storage are healthy, restore network reachability, replace a failing volume, or remove an intentional throttle. Watch ISR membership and replication progress while the follower catches up. A follower that returns to the ISR too quickly and falls out again is evidence of an unresolved fault.
Use bounded recovery controls. Throttles can protect client traffic from a catch-up storm, but extend the time during which redundancy is incomplete. Removing all limits can protect recovery time while starving producers and consumers. Record the chosen trade-off in the incident timeline.
4.4Investigate after stability returns
Once the ISR is healthy and application signals are normal, correlate the event across broker logs, controller logs, host metrics, cloud events, and deployment history. Look for the first causal change, not the loudest symptom. A process restart may be the result of storage latency. A storage alarm may be the result of a replay job. A sudden ISR collapse may be downstream of a network policy change.
Close with a concrete prevention item: a missing alert dimension, an untested broker replacement, an unsafe maintenance default, insufficient headroom, or a failure-domain placement gap. “Monitor URP” is not a prevention plan. The next runbook revision should state which evidence distinguishes the three failure shapes and who owns each action.
5How shared storage rewrites the URP story
The field guide above assumes the traditional Kafka durability model: partitions are stored on broker-local disks, and ISR replication protects the data across brokers. That model makes URP a direct signal that a partition's intended replica set is not fully healthy. It also means recovery work can include moving retained bytes, rebuilding local logs, and competing with user traffic for disk and network capacity.
The architectural requirement that follows is specific: keep Kafka's client and partition semantics while reducing the amount of durable history tied to one broker's local storage. AutoMQ addresses that requirement as a Kafka-compatible cloud-native streaming platform using Shared Storage architecture. Its brokers handle Kafka protocol work, leadership, routing, and caching, while S3Stream writes durable data through WAL storage and S3-compatible object storage. The broker is not the long-term home of a partition's durable history.
That changes what an operator watches during a broker event. Traditional ISR health is no longer the primary durability signal because AutoMQ uses the durability of shared storage rather than traditional broker-to-broker replicas. The corresponding runbook needs to follow leader and metadata scheduling, WAL health, object storage access, cache warm-up, storage permissions, and client errors. A broker can still fail. The recovery question moves from “which follower will rebuild this broker's local log?” toward “can another broker resume the workload against the same durable stream state?”
This is a different failure surface, not an absence of failure modes. An object storage outage, an unavailable WAL storage path, a bad IAM policy, metadata pressure, or a cold cache can still affect availability and recovery. AutoMQ's Shared Storage architecture and WAL storage model make those dependencies explicit, which lets the on-call checklist change with the architecture instead of carrying forward a replica-rebuild assumption.
For a production evaluation, test both models against the same evidence: producer acknowledgment behavior, consumer freshness, leader changes, storage errors, recovery duration, and the point at which the service owner declares the incident contained. Kafka compatibility reduces client migration risk, but it does not remove the need to validate authentication, topic settings, offsets, observability, and rollback. A shared storage design should earn trust in the same way as a broker-local design: through a failure drill with a clear owner and a measurable recovery boundary.
At 2 a.m., the right response to URP is not a memorized command. It is a sequence that protects the redundancy contract without sacrificing the service that contract is meant to protect. Scope the alert, stop adding work, repair the failing path, and only then decide whether the architecture is creating too much recovery work. If broker-local replica rebuilds are the recurring bottleneck, review AutoMQ's Kafka compatibility and deployment options against your own URP drill, failure domains, and rollback criteria.
6FAQ
6.1What does an under-replicated partition mean in Kafka?
It means the partition's ISR is smaller than its configured replication factor. The condition indicates incomplete redundancy. It does not, by itself, prove data loss or tell you whether client traffic is failing.
6.2Is a URP alert always an outage?
No. A short-lived follower lag event can leave producers and consumers healthy. A growing URP count, offline partitions, failed writes, or a surviving ISR concentrated in one failure domain raises the severity and should be treated as an active availability or durability incident.
6.3Should I restart the broker that appears in the URP alert?
Only after checking why it is behind. Restarting a flapping process can add leader movement and connection churn, while a network or storage fault will remain. Capture evidence, classify the failure shape, and isolate the broker only when the remaining ISR and write policy can carry the workload.
6.4Does min.insync.replicas fix under-replicated partitions?
No. It defines how many ISR members must be available for writes that use a suitable acknowledgment mode. It does not repair a follower or restore ISR membership. Changing it during an incident can weaken the durability policy.
6.5How does shared storage change the URP runbook?
In a broker-local design, URP directly describes the health of the broker replica set. In a Shared Storage architecture, durable data is not maintained through the same broker-to-broker replica model, so the runbook emphasizes leader scheduling, WAL, object storage access, cache behavior, and client recovery signals instead.
7References
- Apache Kafka replication documentation
- Apache Kafka topic configuration:
min.insync.replicas - Apache Kafka broker configuration: unclean leader election
- Apache Kafka monitoring documentation
- AutoMQ compatibility with Apache Kafka
- AutoMQ Shared Storage architecture
- AutoMQ S3Stream overview
- AutoMQ WAL storage


