
Table of Contents
Table of Contents
A WarpStream proof of concept can look impressive or disappointing depending on one hidden choice: which latency you decide to measure. A producer-only test with large batches tells you whether the ingest path can move data efficiently. It does not tell you how a tailing consumer behaves when another team starts a backfill, how p99 fetch latency moves after an Agent restart, or whether object storage request patterns will stay inside the cost envelope you modeled.
That distinction matters because WarpStream is not traditional Kafka with a different disk. WarpStream's public architecture describes stateless Agents that speak the Apache Kafka protocol, write durable data to object storage, and coordinate metadata through WarpStream's cloud service. Its low-latency documentation is equally direct: the default configuration is tuned for maximum throughput and minimal costs at the expense of higher latency, while lower latency is possible through client linger, Agent batch timeout, cluster tier, S3 Express, and lightning topics.
The production question is narrower: under your topic mix, reader mix, retention pattern, and failure model, which settings produce acceptable p50, p95, and p99 latency without moving cost or consistency risk somewhere you forgot to test?
1Why generic benchmarks are not enough
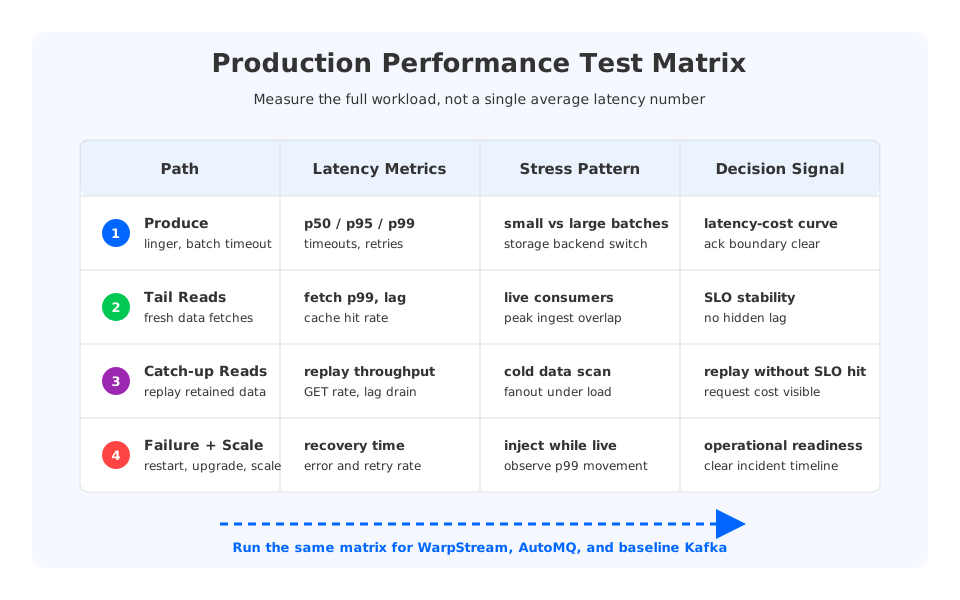
Most Kafka performance conversations compress too much into one number. A single "produce latency" result may hide producer batching, acknowledgement settings, payload size, partition count, compression, network placement, object storage class, metadata latency, and consumer behavior. It may also skip the moments that hurt production systems: consumer lag, hot partitions, node restarts, and scale events.
WarpStream makes those omissions more expensive because its architecture deliberately changes the storage path. Kafka brokers normally append to local log segments and replicate across brokers. WarpStream Agents are stateless, durable records land in object storage, and metadata maps files to Kafka topic-partition offset ranges. That design can reduce the operational burden of broker-local disks and partition rebalancing, but it also makes batching, object operation latency, metadata coordination, and cache locality first-class performance variables.
The official WarpStream low-latency guide gives a useful baseline for what to investigate. It lists a default setup with 25 ms client linger, 250 ms Agent batch timeout, S3 Standard, and Fundamental cluster tier, with produce latency shown as p50 250 ms and p99 500 ms. It also shows lower-latency setups, including S3 Express and reduced batch timeout, with produce p99 below 150 ms, and lightning topics with produce p99 below 50 ms. These figures are not a substitute for your PoC; they map knobs that can change results.
Apache Kafka teams should read that map as a tradeoff table. Lowering Agent batch timeout can reduce produce latency, but WarpStream notes that it creates more object storage files and increases PUT request costs. Lightning topics can reduce produce latency further, but their documentation calls out relaxed consistency characteristics. S3 Express can reduce storage latency, but AWS describes S3 Express One Zone as a single-Availability-Zone storage class, which changes the durability and placement conversation compared with regional S3 Standard.
2Metrics to measure
A production test should separate client-visible latency from system-side resource behavior. If those are mixed together, a low p99 result can mask an object storage bill, and a high p99 result can be blamed on the wrong layer.
| Test dimension | Primary metrics | Why it matters |
|---|---|---|
| Produce path | p50, p95, p99, timeout rate, retry rate, request size | Validates client linger, Agent batch timeout, acknowledgement boundary, and storage backend choice |
| Tail reads | fetch p50/p95/p99, consumer lag, cache hit rate | Shows whether fresh data is served predictably under normal consumption |
| Catch-up reads | replay throughput, lag reduction rate, object GET rate | Exposes behavior when retained data becomes active again |
| Fanout | per-group fetch latency, cache pressure, repeated read amplification | Reveals the effect of many independent consumer groups |
| Failure and scaling | latency during restart, scale-out, scale-in, upgrade | Tests the promise of stateless Agents under operational change |
| Cost surface | object PUT/GET count, cross-AZ traffic, compute, cache, control-plane tier | Prevents performance tuning from becoming an unmodeled cost shift |
2.1Produce latency
Start with the producer path because it is the easiest number to get and the easiest number to overinterpret. Run the same workload across at least three profiles: a throughput-oriented profile, a low-latency profile, and the profile you expect to use in production. For each profile, record producer linger.ms, batch size, compression, acks, payload distribution, partitions, producer count, and the exact WarpStream settings for Agent batch timeout, storage backend, and cluster tier.
The useful output is not one winner. It is a curve. When you move from 250 ms Agent batch timeout to 50 ms or 25 ms, does p99 improve linearly, or does it flatten after the producer-side settings are corrected? When you reduce client linger, does throughput fall enough to change compute or request cost? When you switch storage backend, does the p99 tail improve only at low throughput, or does it hold under peak ingest?
Also test the acknowledgement boundary explicitly. WarpStream's low-latency documentation states that produce requests are never acknowledged before data is durably persisted in object storage when using the Agent batch timeout path. Lightning topics are different: they journal produce requests and commit them to the control plane asynchronously. A PoC report should document which topic type is tested and which consistency model the application requires.
2.2Tail reads and catch-up reads
Tail reads answer the ordinary production question: can consumers stay close to the head of the log while producers are active? Measure fetch latency percentiles, consumer lag, records per second, bytes per second, cache hit rate if exposed, and object GET behavior. Keep the test long enough for cache and compaction behavior to settle; a short run can accidentally measure a warm happy path.
Catch-up reads answer a different question. What happens when a consumer group is down for hours, a stream processor replays retained data, or an incident forces a topic-level backfill? AWS states that S3 can scale to at least 3,500 write-type requests and 5,500 GET/HEAD requests per second per partitioned prefix, with scaling that is gradual and workload dependent. That is a strong cloud primitive, but your benchmark can still stress it through object layout, prefix strategy, replay parallelism, and cache churn.
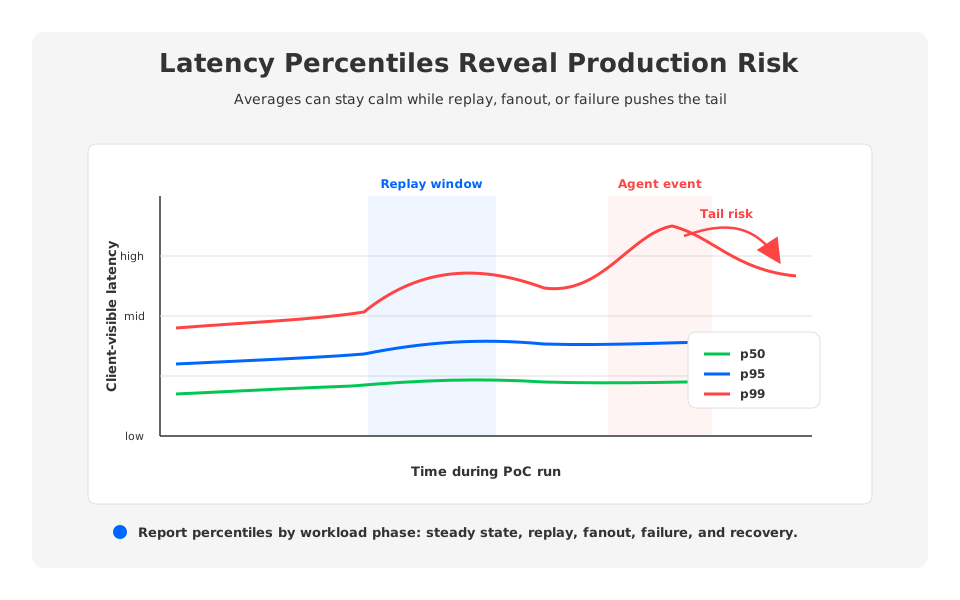
The catch-up test should run alongside live tailing consumers. A backfill that looks excellent in isolation can still damage production if it evicts hot cache entries, increases object request latency, or competes with Agents serving fresh data. Track p99 tail latency while replay throughput ramps up. The right result is not only "the replay finished"; it is "the replay finished without violating the live SLO."
2.3Failover and scaling impact
WarpStream's stateless Agent model is one of its major architectural claims. Because durable data is not tied to local broker disks, Agents can be restarted or scaled without the same data-rebalance pattern Kafka operators associate with stateful brokers. Your test plan should validate that operational promise under your workload, not only under an empty cluster.
Inject failures while producers and consumers are running. Restart one Agent, terminate an Agent, roll a version, scale out, and scale in. For each event, measure error rate, retry rate, produce p99, fetch p99, consumer lag, and recovery time. If the deployment spans multiple Availability Zones, repeat the test with traffic and storage placement that reflects the real topology. The question is not whether the system recovers in theory; it is whether client-visible latency and lag remain inside the budget your applications can tolerate.
This is also where observability often fails a PoC. A platform team should be able to explain a p99 spike from metrics rather than from guesswork. At minimum, the dashboard should separate producer latency, Agent CPU and network, metadata/control-plane latency or errors, object storage operations, cache behavior, consumer lag, and client retries. If those signals are missing, the PoC is not complete even if the benchmark numbers look acceptable.
3Workload patterns that change results
The same WarpStream configuration can behave differently across workloads. High-throughput topics give Agents more opportunity to create efficient files. Sparse topics can be more sensitive to flush timing. One tailing consumer group may see stable cache locality, while many independent groups can increase repeated reads. A backfill-heavy platform may care less about first-write p99 than replay throughput under live traffic.
This is why benchmark fixtures should be shaped like the production estate. Include at least one high-throughput topic, one low-volume topic, one hot partition scenario, one many-consumer-groups scenario, one cold replay, and one retention scan or compaction-sensitive period. If your real Kafka estate uses Kafka Connect, Flink, Kafka Streams, or custom consumers with different fetch sizes, include them as clients rather than replacing them with a synthetic reader.
The workload matrix should also include configuration boundaries:
- Batching boundary: client
linger.ms, producer batch size, Agent batch timeout, and topic type. - Storage boundary: S3 Standard, S3 Express One Zone, Azure Premium Blob Storage, or another supported low-latency backend.
- Metadata boundary: cluster tier, control-plane behavior, metadata operation latency, and error handling.
- Read boundary: hot tail, warm replay, cold replay, fanout, cache hit rate, and object GET pattern.
- Operational boundary: Agent restart, scale events, rolling upgrade, object storage throttling symptoms, and network disruption.
Treat every boundary as a hypothesis. If lower batch timeout improves p99 but object operation count rises sharply, the result is a tradeoff. If S3 Express improves write latency but changes AZ placement assumptions, the result is an architecture decision. If lightning topics meet write latency targets but the relaxed consistency caveats do not fit the application, the result is useful even though the benchmark "won."
4Testing WarpStream and AutoMQ with the same plan
WarpStream belongs to a broader category of Kafka-compatible systems that decouple compute from broker-local durable storage. AutoMQ fits that category too, though its architecture is different: AutoMQ presents Kafka-compatible brokers and uses S3Stream shared storage with a WAL layer, object storage, and data caching for tailing and catch-up reads. That means the fairest evaluation is not to compare slogans. It is to run the same workload, the same SLOs, and the same failure tests across candidates.
For AutoMQ, the test plan should pay attention to the WAL and cache path. AutoMQ documentation describes S3Stream as offloading Kafka log storage to object storage while using WAL storage to address object storage's latency and IOPS limitations. It also describes caching for hot data and prefetched cold data to accelerate both tailing reads and catch-up reads. Those design choices should show up in the metrics: produce p99, fetch p99, cache hit rate, catch-up throughput, and behavior during broker replacement or scaling.
The same framing works for traditional Kafka and managed Kafka services. Local-disk Kafka should be tested for broker failure, partition movement, disk saturation, page cache behavior, and replication overhead. WarpStream should be tested for Agent behavior, object storage interaction, metadata/control-plane dependency, and topic-type tradeoffs. AutoMQ should be tested for Kafka compatibility, WAL durability and latency, object storage persistence, cache behavior, and stateless broker operations.
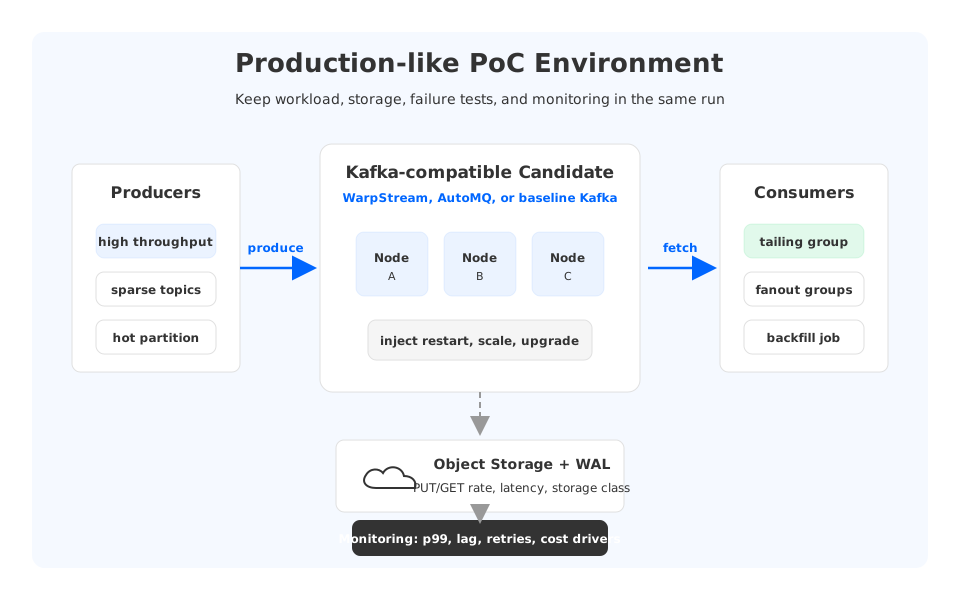
The comparison table should be reproducible. WarpStream tests should name Agent batch timeout, storage backend, topic type, object GET rate, cache behavior, and control-plane dependency. AutoMQ tests should name WAL path, broker settings, S3Stream persistence, cache hit rate, object storage behavior, and broker replacement. Traditional Kafka tests should name broker append latency, ISR behavior, disk throughput, partition reassignment, and cross-AZ replication cost.
This approach keeps the product discussion honest. AutoMQ should enter the shortlist when a team wants Kafka compatibility with object-storage-backed shared storage, stateless broker operations, and a WAL/cache design that can be tested against the same latency and replay requirements. WarpStream should stay in the shortlist when its Agent model, BYOC-style data placement, and tuning knobs fit the application's consistency, latency, and cost envelope.
5Production readiness test plan
A production-grade PoC needs a written test plan before the first benchmark runs. Otherwise, teams tune until one metric looks good and discover the missing scenario later.
Use this checklist as a starting point:
- Define SLOs first: produce p99, fetch p99, end-to-end latency, acceptable consumer lag, replay completion time, error budget, and recovery time.
- Mirror production clients: use representative producers, consumers, connectors, stream processors, payload sizes, partitions, compression, and security settings.
- Run long enough: include warm-up, steady state, peak traffic, retention growth, replay, and failure periods.
- Separate workload classes: report high-throughput topics, sparse topics, hot partitions, fanout, and catch-up reads independently.
- Capture cost drivers: object PUT/GET counts, storage class, network transfer, compute, cache, and paid control-plane tier.
- Inject operational events: Agent or broker restart, scale-out, scale-in, rolling upgrade, client retry storms, and object-storage slowdown symptoms.
- Keep rollback real: document how clients, topics, offsets, ACLs, connectors, and observability move back if the production cutover is paused.
The report should end with three artifacts: a latency percentile table, a resource and cost table, and an incident-style timeline for each failure test. Screenshots of a dashboard are less useful than the underlying numbers and configuration. A good PoC lets another engineer rerun the test and argue with the conclusion.
6References
- WarpStream Architecture
- WarpStream Low Latency Clusters
- WarpStream Lightning Topics
- Confluent and WarpStream Announcement
- Apache Kafka Documentation
- Apache Kafka Producer Configuration
- Amazon S3 Performance Guidelines
- Amazon S3 Express One Zone
- AutoMQ S3Stream Shared Streaming Storage
- AutoMQ Architecture Overview
7FAQ
7.1What is a realistic WarpStream latency test?
A realistic test measures produce, fetch, end-to-end latency, consumer lag, catch-up reads, fanout, failure recovery, and object storage request behavior under the same workload. A producer-only benchmark is a useful first signal, but it is not enough for production readiness.
7.2Why does WarpStream latency depend on batching?
WarpStream Agents batch data before writing to object storage. The official low-latency guide says Agent batch timeout directly affects produce latency, while lower timeout values can create more files and increase object storage PUT request costs.
7.3Should I test p99 or average latency?
Test both, but use p95 and p99 for production decisions. Average latency hides tail behavior, and tail behavior is usually what breaks streaming applications during replay, failure, or traffic spikes.
7.4Are lightning topics always the right low-latency choice?
No. WarpStream documents lightning topics as a lower-produce-latency option with relaxed consistency caveats. They should be tested only against applications that can accept that model.
7.5How should AutoMQ be compared with WarpStream?
Use the same workload and SLOs. WarpStream tests should focus on Agents, object storage, topic type, and metadata/control-plane behavior. AutoMQ tests should focus on Kafka compatibility, WAL latency, cache behavior, S3Stream persistence, and stateless broker operations.


