
Table of Contents
Table of Contents
A new consumer group can make an Amazon MSK cluster look like it needs more brokers even when producer traffic has not changed. Every independent group reads its own copy of a topic’s records. If several applications replay the same partitions, the broker serves several fetch streams, the network carries the data several times, and each downstream system does its own work.
That is read fan-out. It is easy to mistake it for a simple consumer-count problem. A consumer group with many members can be limited by partition parallelism or a slow processor, while a cluster with a few groups can be limited by broker fetch time or network egress. Adding brokers helps only when broker capacity is the limiting resource. Measure the read path first, then choose the smallest change that removes the constraint.
1What read fan-out changes
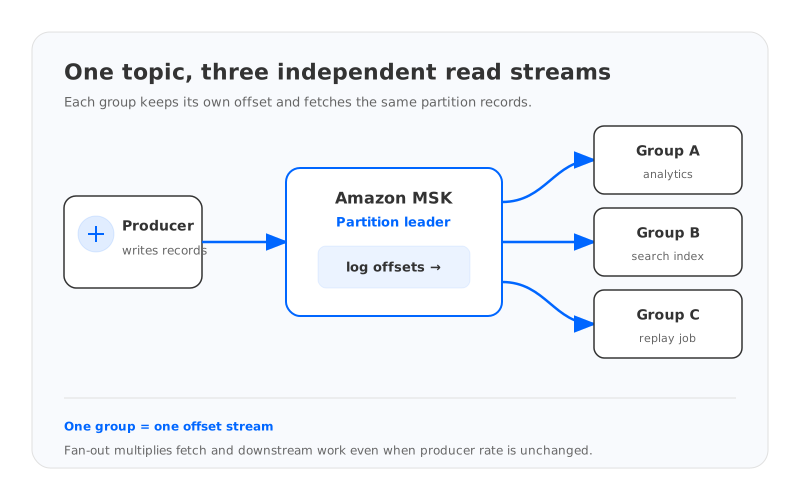
Kafka assigns each partition to one consumer within a consumer group. Two independent groups both receive the records, so the same partition may be fetched once for an analytics application, once for search indexing, and again for a replay or replication workflow. The groups do not share a position: each group commits and advances its own offsets.
A first-order planning model is:
read work ≈ produced bytes × active consumer groups × replay factor
This is a sizing aid, not a billing formula. Compression, fetch batching, protocol overhead, partition distribution, and the broker’s local storage path change the actual work. Replication traffic is a separate dimension. The value of the model is that it makes a hidden multiplier visible: adding a group can increase read work without adding a single producer.
The distinction between group fan-out and member parallelism matters. Adding members to an existing group can improve parallel processing only while there are unassigned partitions and the application can keep up. Adding a new group increases the number of independent reads. Treat those operations as different capacity events in a change review.
2Map the read path before changing capacity
Start with one topic and follow a record from the partition leader to every independent reader:
- The producer writes records to partition leaders.
- Each consumer group fetches assigned partitions and maintains its own committed offset.
- The broker returns batches according to the client’s fetch settings and available data.
- The consumer deserializes, processes, and commits the result downstream.
The broker is only one part of this path. A consumer with low application throughput can create lag even when broker fetch latency is healthy. Conversely, a fast consumer fleet can expose broker request queues or network limits when many groups read the same hot partitions. Record the owner and location of every group, including batch jobs and temporary replay consumers; those are often the missing readers in an incident review.
A simple topology map should include topic, partitions, group names, client subnets or Availability Zones, and downstream destinations. Mark whether each group is continuous, bursty, or replay-only. This turns “consumer scaling” into a workload inventory that can be measured.
3Measure broker fetch pressure and client progress together
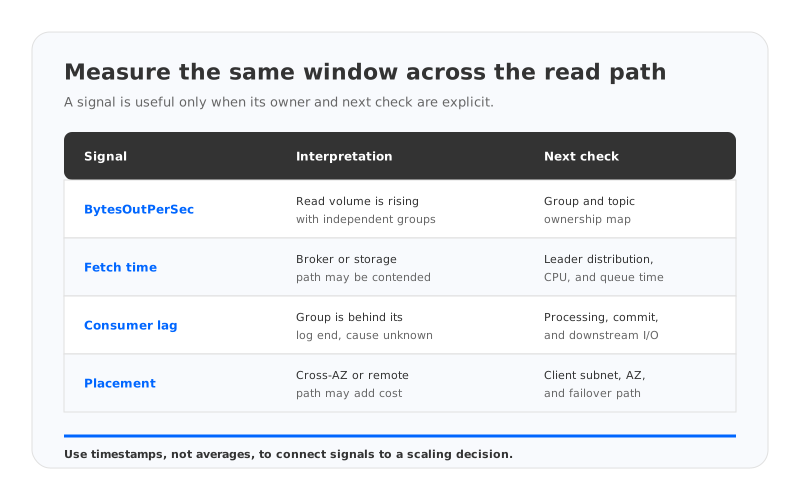
Do not use consumer lag as a proxy for broker saturation. Lag says that a group is behind its log end; it does not say whether the group is waiting on the broker, CPU, a downstream service, or a deliberate pause. Pair lag with fetch, network, and application signals over the same time window.
Amazon MSK exposes broker and cluster metrics through CloudWatch. Metrics such as BytesOutPerSec, FetchConsumerTotalTimeMsMean, FetchConsumerLocalTimeMsMean, FetchConsumerRequestQueueTimeMsMean, and FetchThrottleTime help separate returned data volume, time spent serving fetches, request queueing, and throttling. The available metric level and dimensions depend on the cluster configuration and current MSK documentation, so confirm the dimensions before building alarms.
On the client side, collect records consumed per second, fetch latency, bytes consumed, records-lag-max, commit latency, rebalance count, and application processing time. Use the consumer group and topic as stable labels. For a replay, also record the start offset and the time range being replayed; otherwise a temporary historical read can be confused with a production traffic increase.
| Observation | What it suggests | Evidence to collect before scaling |
|---|---|---|
| Consumer lag rises while fetch and broker queue time remain normal | Downstream processing or commit path is slow | Processing time, batch size, errors, commit latency |
| Fetch total time and local time rise with bytes out | Broker read or storage path is under pressure | Per-broker fetch metrics, topic/partition distribution, disk and CPU |
| Request queue time rises while clients are ready to fetch | Broker request handlers or network path are contended | Request queue, network transmit, connection count, partition leaders |
| Fetch throttle time appears with high read volume | A quota or configured throttle is shaping reads | Throttle metrics, client configuration, quota policy, change history |
| Only one group is slow | Group placement or application behavior is localized | Group members, AZ/subnet, consumer logs, downstream dependency |
The same timestamps matter. Compare a five-minute burst in consumer lag with the corresponding broker fetch and network series, rather than comparing unrelated daily averages.
4Test fan-out in a controlled window
A production dashboard rarely proves causality by itself. Reproduce the shape in a staging topic or a representative low-risk partition set. Keep producer rate, record size, compression, partition count, and retention policy constant. Add one independent group at a time, then run a replay with a known offset range.
For every step, capture:
- Bytes produced and bytes consumed per group.
- Fetch latency and broker request queue time.
- Consumer processing and commit latency.
- Network transmit at the broker and client path.
- Partition assignment and the AZ or subnet of each member.
- Lag growth and catch-up time after the test ends.
The test is useful even when it does not saturate the cluster. A linear increase in client bytes with each group confirms the fan-out shape. A nonlinear increase in fetch queue time suggests that a broker or network boundary is becoming the bottleneck. A flat broker profile with growing application time points to the downstream system instead.
Keep the test’s limits explicit. Staging may have different broker types, partitions, quotas, or network paths from production. Treat the result as a mechanism check and a way to rank measurements, not as a universal throughput benchmark.
5Decide whether the constraint is partitions, brokers, network, or consumers
Consumer scaling has four common boundaries:
- Partition parallelism. A group cannot process more partitions concurrently than the topic provides. Adding members beyond the available assignments does not increase useful work.
- Broker fetch capacity. Many groups can increase fetch requests and bytes returned from the same leaders. Rising fetch local or queue time, paired with high bytes out, points here.
- Network path. A group in another AZ, VPC, Region, or service boundary can add transfer and latency. Broker and client network series should be read with placement data.
- Downstream processing. Serialization, CPU, storage writes, API calls, or commit operations can hold a consumer back while broker metrics remain steady.
Use a decision gate before adding capacity:
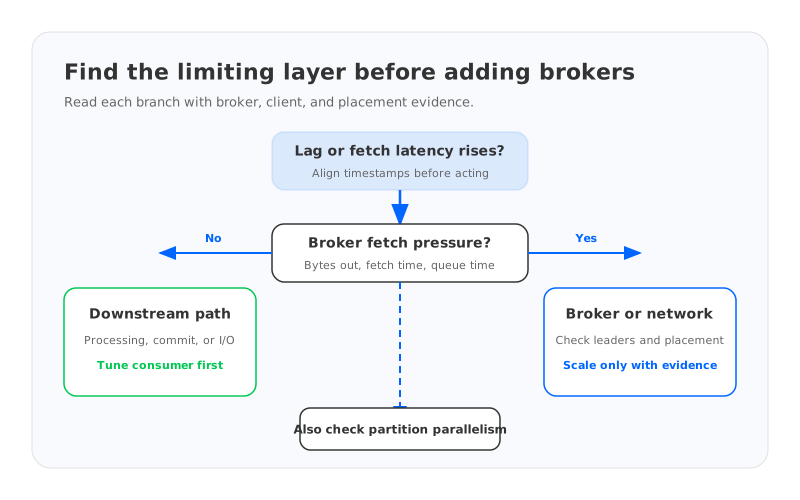
If only one group is slow and the broker profile is healthy, tune or scale that application first. If many groups show higher fetch time on the same leaders, review partition leadership and broker capacity. If all groups slow when clients move across an AZ boundary, fix placement or the network path before buying broker capacity. If the topic has too few partitions, a partition expansion may improve parallelism, but it also changes key distribution and requires its own validation.
Broker addition is justified when the evidence shows a sustained broker-side limit and the new placement can spread the hot leaders or read workload. It is not a general remedy for a downstream dependency or a group with too few partitions. Write the expected signal change into the change plan: for example, lower per-broker fetch time and queue time while client processing time remains stable. That makes the result testable after the change.
6Mitigation choices for high fan-out
The right mitigation depends on why the same data is read repeatedly.
Reduce independent reads when semantics allow it. A shared consumer group can distribute work among members, but it changes delivery semantics. Use it only when the applications can share a processing contract and offset lifecycle. Do not merge groups simply to make a dashboard look healthier.
Materialize a derived topic. If many applications repeatedly filter or transform the same source, one controlled consumer can publish a smaller, purpose-built topic. This trades an extra write and a new ownership boundary for less repeated source scanning. Define schema, retention, replay, and failure ownership before adopting it.
Schedule replay work. A replay consumer should have a declared window, rate limit, and stop condition. Run it away from the busiest production periods when possible, and tag its metrics so it cannot be mistaken for a steady-state group.
Improve locality. Place consumers near the brokers and downstream services they use, while keeping the availability and failover design intact. Locality can reduce latency and transfer, but it does not remove the logical read multiplier created by independent groups.
Scale the constrained layer. Increase consumer members when partitions and application parallelism are available. Add partitions when the topic’s key and ordering model permits it. Add or resize brokers only when broker-side measurements show that fetch work is the limiting resource.
7Review capacity with a read budget
Create a weekly read budget for each production topic. The budget does not need a single magic threshold; it needs an owner, a baseline, and an explanation for change. Track steady-state groups, replay groups, bytes consumed, peak fetch time, lag recovery time, and the expected growth in partitions and consumers.
A review can use questions such as:
- How many independent groups read the topic, and which ones are optional or temporary?
- What is the peak bytes-per-second per group, and how much replay traffic is planned?
- Which brokers lead the hottest partitions, and do the groups share those leaders?
- Does cross-AZ placement add a measurable path cost or recovery risk?
- Which signal should improve after the proposed change, and what result would disprove the hypothesis?
Keep the budget tied to a runbook. When a new group is approved, record its expected read rate, retention or replay behavior, owner, and rollback action. When a group is removed, verify that its connections and alerts disappear. This prevents “ghost readers” from becoming permanent capacity assumptions.
8Where AutoMQ fits in the decision
The measurement framework can reveal a structural problem: broker-local storage and broker compute are being scaled together even though the read workload is uneven or replay-heavy. In that case, a team can evaluate an architecture that separates serving compute from shared, object-storage-backed durability. The read multiplier still exists, and downstream systems still need capacity, but the storage and broker scaling decisions can be reviewed independently.
AutoMQ is a Kafka-compatible cloud-native streaming platform with stateless broker processes and shared storage. Its relevance is conditional. Teams should run the same fan-out experiment against representative topics, consumer groups, replay windows, network paths, and recovery objectives. Validate Kafka client behavior, partition assignment, observability, and failover before treating a different storage boundary as a solution to a read bottleneck.
A fair comparison keeps the read budget constant. Measure broker fetch time, client bytes, consumer processing, network placement, and catch-up time on both architectures. If the bottleneck is a downstream database or a topic with insufficient partitions, changing the storage layer will not remove it. If broker-local storage and compute coupling is the constraint, a shared-storage design may be worth a focused architecture review.
9FAQ
9.1Does adding consumer groups always require more Amazon MSK brokers?
No. A new group increases independent reads, but the limiting resource may be consumer CPU, downstream I/O, network placement, or partitions. Add brokers only after broker-side fetch and queue measurements show a sustained capacity limit.
9.2What is the difference between adding consumers and adding consumer groups?
Adding consumers to one group increases parallelism up to the number of partitions and the application’s ability to process them. Adding a group creates another offset stream that reads the records independently and increases read fan-out.
9.3Which Amazon MSK metrics help diagnose read fan-out?
Start with bytes returned, fetch total and local time, request queue time, throttling, and per-group consumer lag. Pair MSK CloudWatch metrics with client fetch latency, processing time, commit latency, and partition assignment. Confirm current metric dimensions in the MSK Developer Guide.
9.4Should replay consumers use a separate topic?
Not necessarily. A separate group can replay a source topic, but it should have an explicit rate limit, owner, time window, and monitoring labels. A derived topic may be better when many applications repeatedly need the same filtered view.
9.5Can AutoMQ eliminate consumer fan-out?
No. Independent Kafka consumer groups still represent independent reads. AutoMQ can be evaluated when separating broker compute from shared storage is relevant, but the same consumer, partition, network, and downstream measurements remain necessary.
10References
- Amazon MSK metrics details
- Monitor Amazon MSK consumer lag
- Amazon MSK Developer Guide
- Kafka consumer configuration
- Kafka consumer design
- AutoMQ architecture overview
When an Amazon MSK consumer fleet slows down, the useful question is not “how many brokers should we add?” It is “which part of the read path is carrying the extra work?” Count independent groups, measure their fetch and processing paths, and write down the signal that should change before approving capacity. Review a Kafka-compatible shared-storage architecture with AutoMQ when that evidence points to a storage and compute boundary worth testing.


