
Table of Contents
Table of Contents
“Kafka is slow” is the kind of alert that makes an on-call engineer open six dashboards. A producer says requests are timing out. A consumer reports growing lag. The broker CPU graph looks normal, but one disk is busy and the network chart has a sharp peak. Those observations can describe one incident or three problems sharing a timestamp.
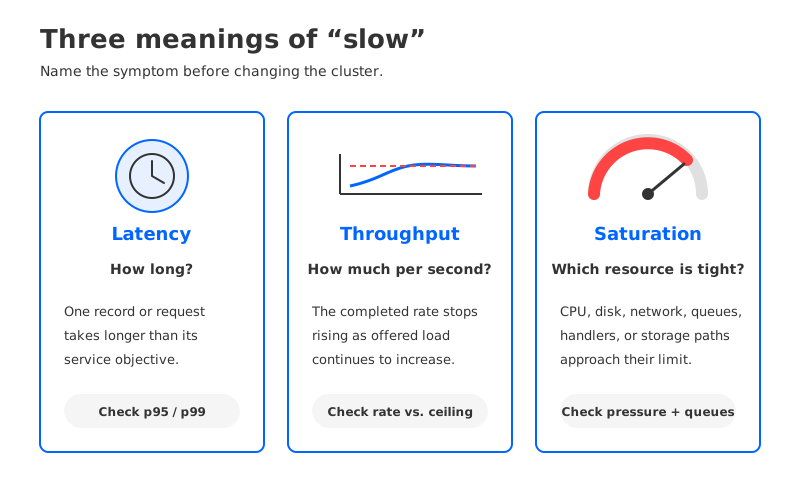
The first response should therefore be a question: slow in which sense? End-to-end latency is the time a record takes to reach its point. Throughput is the rate the system can accept or deliver. Saturation is a resource or queue approaching the limit that constrains that work. They interact, but they are not interchangeable metrics.
This distinction is practical. A latency fix can reduce batching and lower maximum throughput. Adding brokers can raise a throughput ceiling while leaving a slow downstream consumer untouched. Moving data to a different storage architecture can change the saturation signals without fixing a client-side timeout. Name the failure mode before changing the system.
1One phrase, three very different tickets
The same user report can point to different measurements. “The dashboard is delayed” may mean records are taking longer to move through the producer, broker, and consumer application. “Kafka cannot keep up” may mean the workload has reached a partition, network, request-handler, or storage limit. “Brokers are overloaded” may mean a particular resource is near capacity even though the average request rate looks acceptable.
Each needs a different first move. For latency, preserve timestamps and look at percentiles. For throughput, look for a sustained rate ceiling and identify the dimension that stops growing. For saturation, correlate utilization with queueing, throttling, errors, and the affected workload. An average such as cluster CPU hides all three.
There is a second trap: the word “Kafka” often includes the application path around the brokers. Producer serialization, DNS, TLS, an intermediary, consumer processing, and a downstream database can all contribute to end-to-end delay. Broker request latency is necessary evidence, but it is not the whole path.
2Latency, throughput, and saturation: definitions that matter
2.1Latency is a time for one record or request
Kafka latency has several useful boundaries. Producer request latency measures the time from a client request until the broker response. End-to-end latency measures a record from an application timestamp at production to an observed point in the consumer path. Consumer processing time belongs after the broker returns data, so it should not be silently attributed to Kafka.
Use percentiles rather than a single mean. A p50 that is stable while p99 rises points to a tail problem, such as a slow partition, queueing, retry, garbage collection pause, network path, or storage wait. Compare the same time window with request rate, batch size, acknowledgment settings, retries, under-replicated partitions, and consumer processing time. The Apache Kafka monitoring documentation provides the metric context; the useful diagnosis comes from correlating those signals.
Latency is not automatically bad when it increases under batching. A producer may intentionally wait for more records to form a batch, trading per-record delay for better wire and disk efficiency. The question is whether the observed p99 violates the workload's service objective, and where the added time appears.
2.2Throughput is a rate, not a delay
Throughput answers how much work crosses a boundary per unit of time: records per second, bytes per second, produce requests per second, or fetch bytes per second. It is a property of a workload and a measurement boundary. Producer throughput, broker ingress, broker egress, and consumer application throughput will not necessarily match.
A throughput ceiling often appears as a plateau. Increase offered load, and the completed rate stops rising while queue time, retries, lag, or rejection increases. That plateau may be per partition rather than per cluster. A topic with too few partitions can hit its limit while idle brokers remain available, so adding brokers without changing partition parallelism does not address the constraint.
Batch size, compression, message size, request concurrency, quotas, replication work, and consumer fan-out all shape the ceiling. Kafka's producer configuration reference is useful when checking batching and acknowledgment assumptions. Treat the values as workload controls, not as universal tuning instructions.
2.3Saturation is pressure on the limiting resource
Saturation means some part of the path is close to the amount of work it can serve within the required time. CPU can saturate, but so can disk bandwidth, disk I/O operations, network bandwidth, broker request handlers, page cache, object storage requests, or a downstream sink. Queue depth and throttling are often earlier evidence than a resource graph reaching 100 percent.
The limiting resource is usually local to a slice of the workload. One broker, partition leader, disk, availability zone, consumer group, or network route can be saturated while the cluster-wide average looks comfortable. Break metrics down by broker, topic, partition, direction, and client group before making a cluster-level change.
The relationship among the three terms is easiest to remember this way: saturation can create latency, and sustained saturation can cap throughput. High latency does not prove saturation, and high throughput does not prove healthy latency. A system can deliver a large byte rate with unacceptable tail delay, or deliver low throughput because the workload is small while one badly placed request is slow.
3Measuring each without a lab
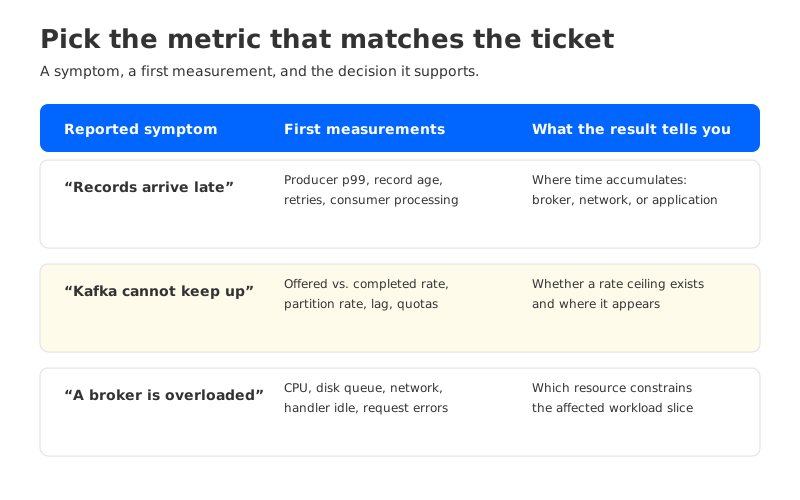
Start with one request path and one time window. Capture the producer timestamp, broker response timestamp, consumer observation timestamp, and application completion timestamp where possible. Then choose the metric that matches the reported symptom.
| Reported symptom | First measurements | What the result tells you |
|---|---|---|
| “Records arrive late” | Producer p50/p95/p99, end-to-end age, retries, consumer processing time | Whether the delay is in the broker path, the network, or after fetch |
| “Kafka cannot keep up” | Offered versus completed bytes and records, partition-level rate, lag, quotas | Whether the system has a real rate ceiling and where it appears |
| “A broker is overloaded” | CPU, disk latency and queue, network bytes, request-handler idle, errors | Which resource is constraining a broker or workload slice |
For latency, preserve the sampling interval and percentile window. A five-minute p99 can hide a short spike, while a one-minute p99 from a low-volume topic can be statistically noisy. Check whether the producer is waiting for acknowledgments, whether the broker is waiting for replication, and whether the consumer is measuring record age or application completion. These are different clocks.
For throughput, compare offered rate with completed rate. If producer send rate rises but broker ingress does not, inspect client retries, quotas, request errors, and partition distribution. If broker ingress rises but consumer delivery does not, inspect fetch rate, consumer concurrency, partition assignment, downstream processing, and lag. If the rate is flat at every layer, the workload may be stable rather than slow.
For saturation, find the first signal that moves with the incident. A busy disk with elevated produce latency suggests a storage path under pressure, but only if the affected partitions and requests line up. High network bytes with normal request processing can indicate a consumer replay or cross-zone path rather than broker CPU pressure. A low request-handler idle rate with growing queues points toward broker-side work, but the next question is which request type is consuming it.
4Four misdiagnoses that cost a week
4.1A slow consumer is blamed on the broker
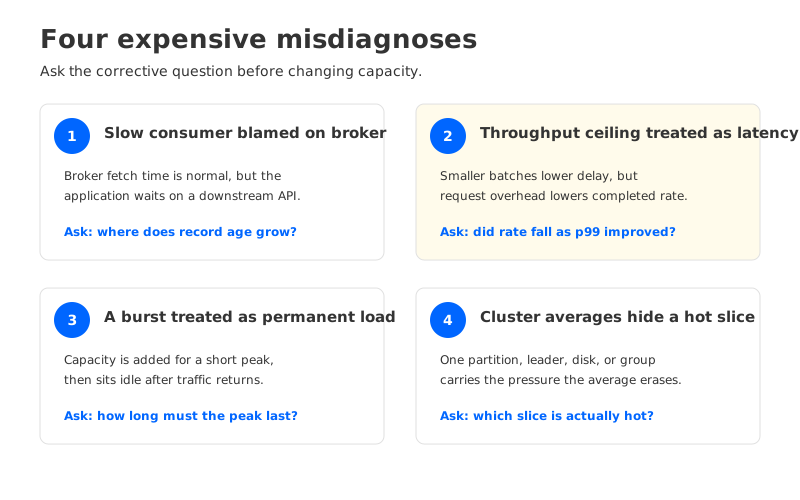
The consumer reports that records are “late,” but broker fetch latency is normal. The consumer spends most of its time deserializing records, waiting on a database, or retrying a downstream API. Increasing brokers changes nothing because the delay occurs after Kafka returns the bytes.
Compare broker fetch response time with consumer processing time and record age. If the broker path is healthy while application completion lags, scale or repair the consumer dependency. Consumer lag is evidence of a difference between production and consumption progress, not proof of broker saturation.
4.2A throughput ceiling is treated as a latency problem
The team lowers batch sizes because a rate test shows increasing delay. Latency improves for individual records, but request overhead rises and the completed throughput falls further. The real limit was per-partition concurrency or network bandwidth, not an arbitrary wait inside the producer.
Run the test with the same message size, compression, partition count, and acknowledgment policy as production. Compare p99 with completed bytes per second. A lower latency number is not a successful change if it reduces the rate below the workload requirement.
4.3A short burst is treated as permanent capacity saturation
A traffic burst drives CPU or network utilization high for a few minutes. The team adds permanent brokers, but the normal workload returns to its old level. The extra capacity then changes placement, cost, and operational overhead without addressing the burst's trigger or duration.
Separate peak rate, burst duration, recovery time, and retained data. If the service objective allows a queue to drain after the burst, a rate limit or consumer policy may be more appropriate. If the peak is now the normal rate, the capacity model should use that new baseline instead.
4.4A partition or storage skew is hidden by cluster averages
The cluster reports moderate CPU and disk use, yet one topic has high p99 and its consumer group falls behind. A hot partition leader, uneven message keys, a replaying consumer, or a single busy storage path can create the symptom. Cluster-wide averages erase the shape that matters.
Break the view down by partition and broker. Check leader distribution, record size, request direction, consumer assignment, and the physical path serving the affected data. Fix the skew or the workload placement before changing every broker. The same reasoning applies to Kafka partition reassignment troubleshooting.
5When the storage architecture changes the saturation map
The diagnosis must follow the architecture. In a traditional Kafka deployment, retained partition data is closely tied to broker-local storage and replication. Disk bandwidth, disk space, replica movement, and broker placement therefore belong in the first saturation hypothesis when the workload changes or a broker fails. For the retention side of that coupling, see the Kafka storage savings guide.
If the system uses shared storage, the same symptom has a different map. AutoMQ replaces Kafka's native storage layer with S3Stream and separates broker compute from durable storage. Its architecture documentation describes object storage as the primary data repository and WAL storage as the write and recovery layer. That means a broker-local disk alert is not automatically the explanation for retained-data pressure, while WAL behavior, object-storage access, network path, cache effectiveness, and client request metrics deserve attention.
This is a change in the troubleshooting map, not a promise that every workload becomes fast. AutoMQ's WAL documentation explains that a successful WAL write is the persistence point for client confirmation and that WAL also supports recovery of data not yet uploaded to object storage. The storage choice therefore creates a latency and recovery boundary that should be measured directly.
The practical rule is to update the dashboard with the platform's actual boundaries. AutoMQ exposes Prometheus metrics for network-thread and request-handler idle rates, message and network throughput, produce and fetch request counts, request failures, and object-storage state. Those signals do not replace end-to-end measurements. They help explain which layer is carrying the work once the architecture no longer matches a broker-local mental model.
6Define it, then fix it
Use this sequence during an incident or capacity review:
- Write the boundary. State whether “slow” means producer acknowledgment, broker request response, consumer record age, application completion, or a sustained rate shortfall.
- Choose the percentile or rate. Use p95 or p99 for a latency objective, completed bytes or records per second for throughput, and resource-plus-queue signals for saturation.
- Partition the evidence. Split by broker, topic, partition, client group, direction, and time window. Do not let a cluster average stand in for the affected slice.
- Correlate before changing configuration. Look for a matching movement in retries, request errors, quotas, lag, leader placement, storage, network, and downstream processing.
- Change one limiting factor. A test should state the expected effect, the observation window, and the rollback condition. “Add capacity” is not a hypothesis.
- Re-measure the original boundary. A lower broker latency that leaves end-to-end age unchanged is not a fix. A higher throughput ceiling that increases tail latency beyond the service objective is a trade-off, not a free improvement.
This process also improves capacity planning. A throughput test should name the partition count, message size, compression, acknowledgments, consumer fan-out, and failure headroom. A latency test should name the timestamp boundaries, percentile, storage path, and workload volume. A saturation review should identify the resource that limits the affected slice and the signal that proves it.
The next time a ticket says “Kafka is slow,” resist the reflex to add brokers or change batching. First decide whether the ticket is about time, rate, or pressure. Once that label is correct, the dashboard, experiment, and architecture discussion become much smaller.
7FAQ
7.1Is Kafka latency the same as consumer lag?
No. Latency measures elapsed time for a request or record across a defined boundary. Consumer lag measures the difference between a consumer's position and the latest available data. A consumer can have low lag while each record takes too long to process, or high lag because processing throughput is below production rate even when broker request latency is normal.
7.2Can high throughput and high latency happen together?
Yes. Batching, queueing, large requests, replication work, or a busy downstream stage can keep the byte rate high while individual records wait longer. Evaluate throughput and latency against separate objectives, and compare percentiles with completed rate.
7.3Does adding Kafka brokers always improve performance?
No. More brokers help when the bottleneck can use additional broker capacity and the workload can distribute across partitions and leaders. They do not fix a hot partition, a slow consumer dependency, an application-side serialization cost, a quota, or a network path outside the brokers.
7.4When should I consider a shared-storage Kafka architecture?
Consider it when broker-local state is a recurring constraint on retention, scaling, recovery, or capacity changes. Keep the evaluation workload-specific: test produce and fetch latency, replay behavior, client compatibility, failure recovery, object-storage and WAL paths, and the operational metrics your team will use in an incident. AutoMQ's architecture guide is a starting point, not a substitute for that test.
8References
- Apache Kafka monitoring
- Apache Kafka producer configurations
- Apache Kafka replication design
- AWS MSK troubleshooting
- AutoMQ architecture overview
- AutoMQ WAL storage
- AutoMQ Prometheus metrics
If the diagnosis points to broker-local storage, recovery movement, or cloud capacity coupling, explore the AutoMQ open-source project and test the same workload boundaries against a Kafka-compatible shared-storage design.


