Metrics Integration
AutoMQ OpenSource utilizes the OpenTelemetry SDK to implement metrics collection and export, enabling the exposure of Apache Kafka business metrics and underlying storage-related metrics. Both types of metrics are unified and transformed using the OTLP format for exposure.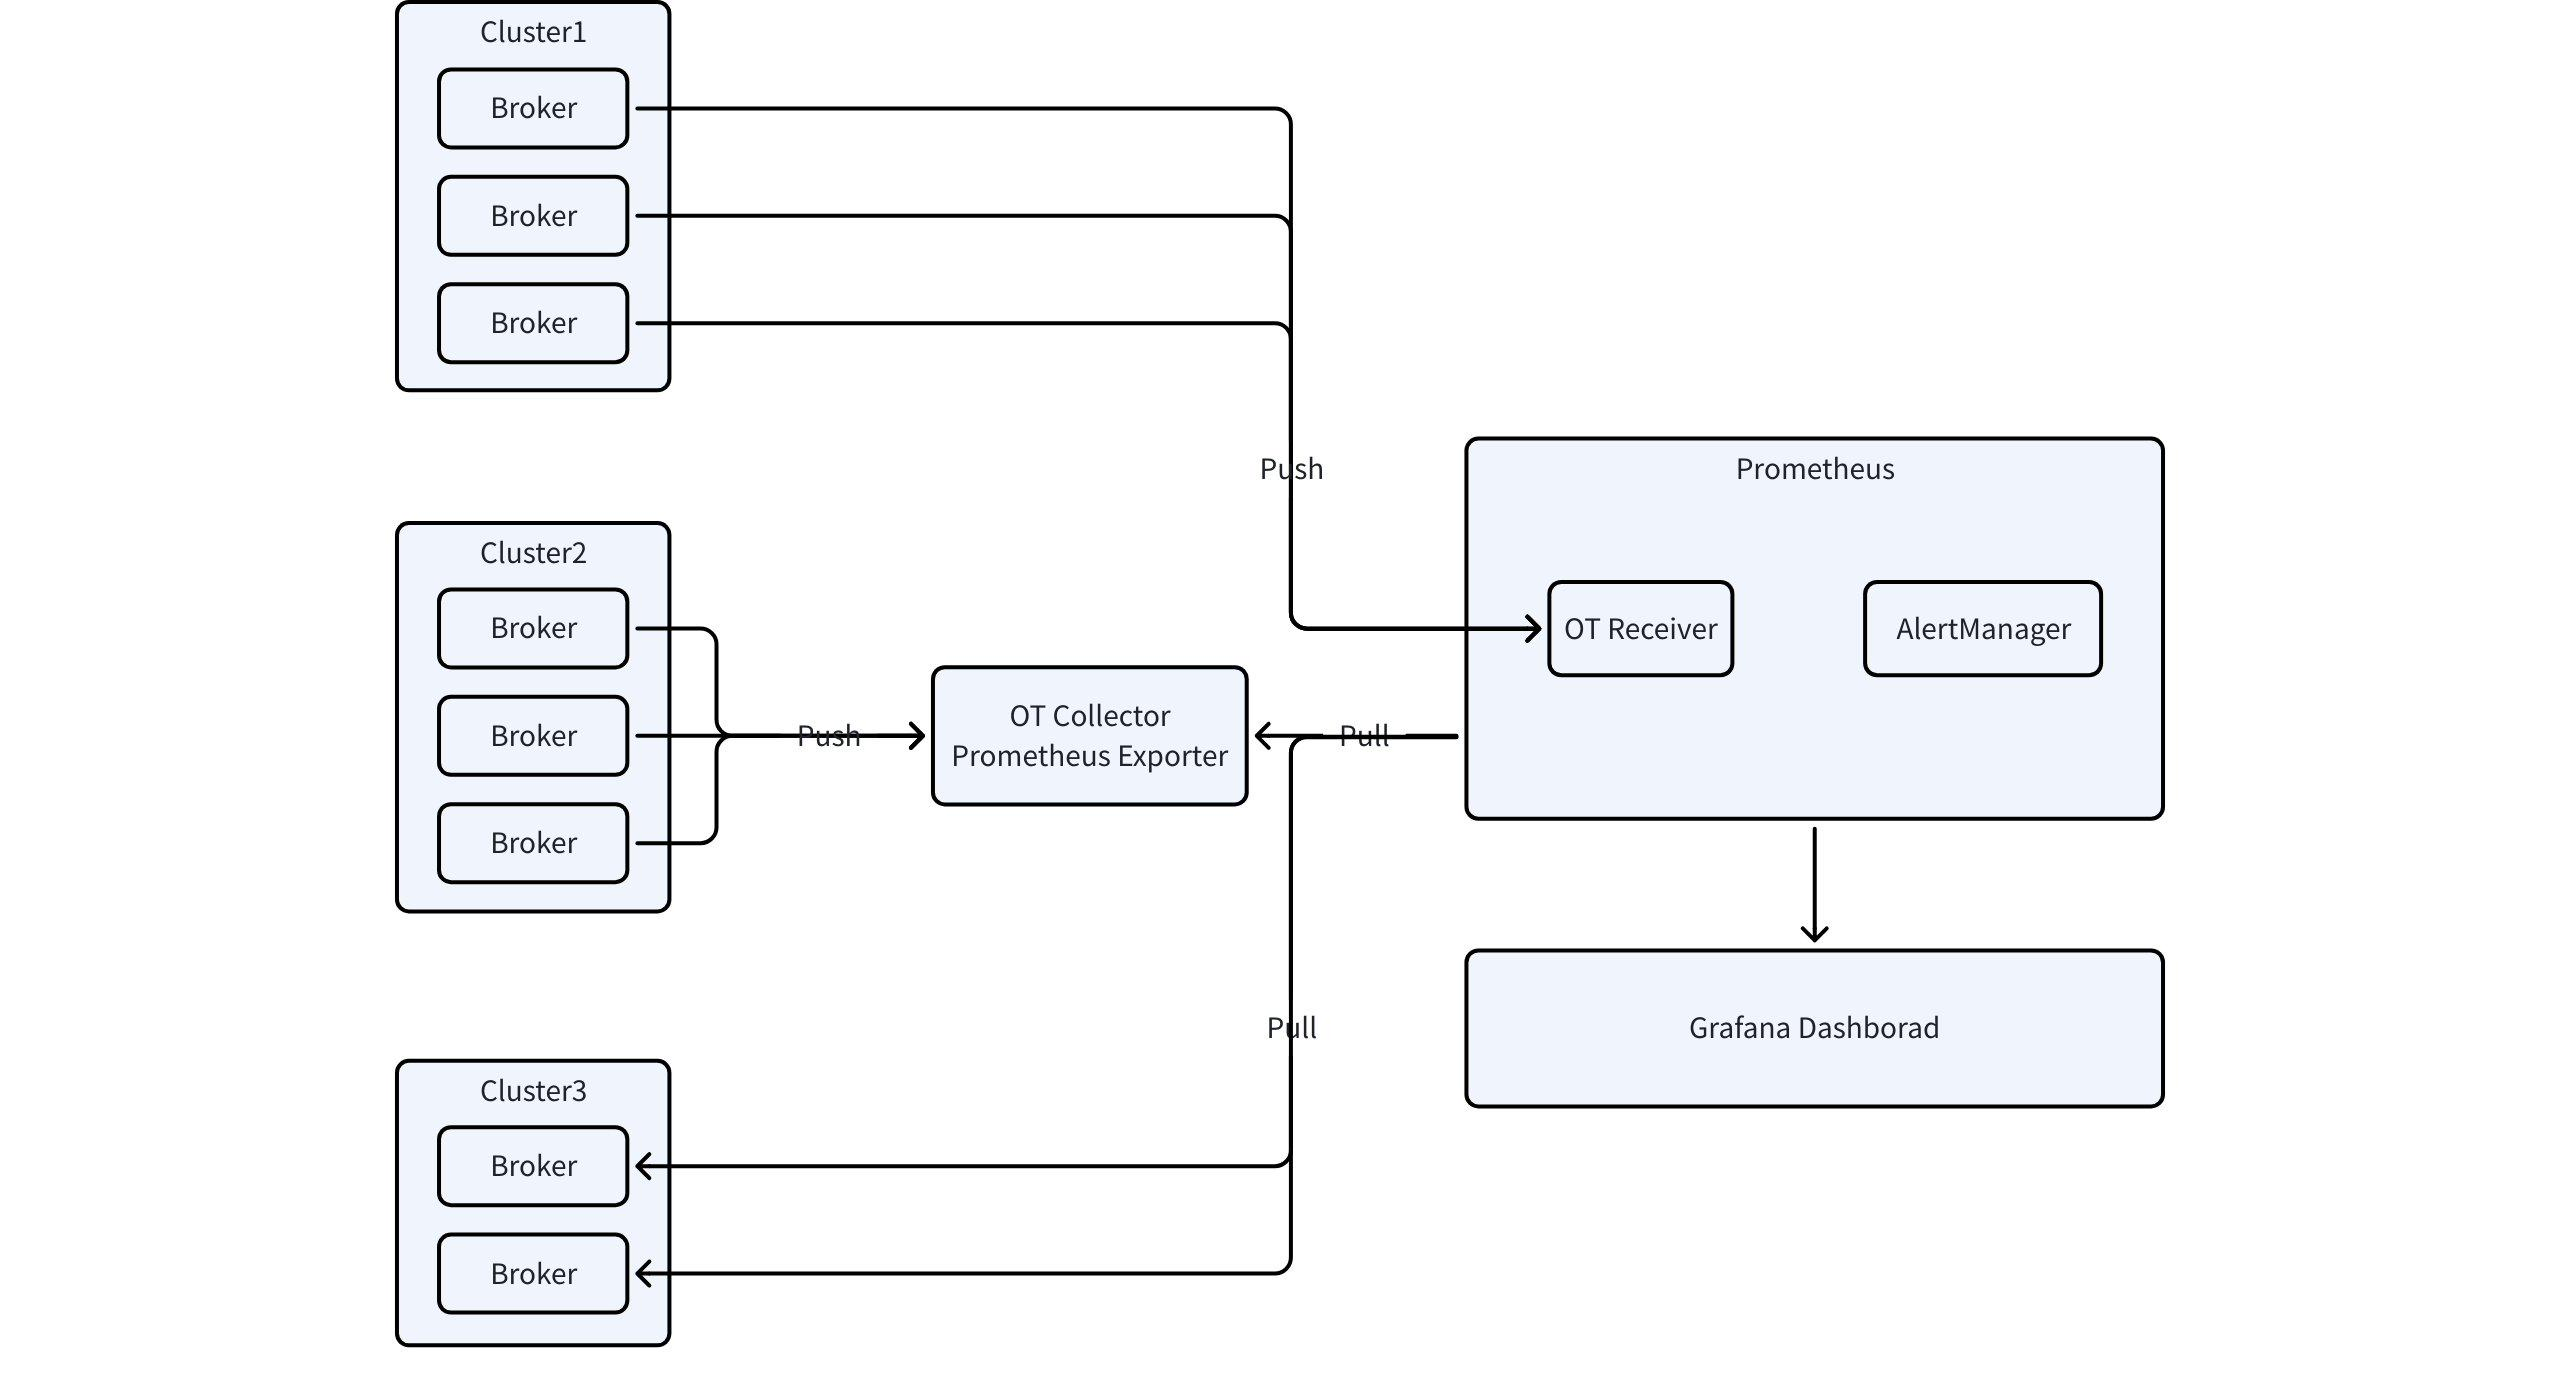
- Using OpenTelemetry Collector
- Using Prometheus OTLP Receiver
- Directly Pulling Metrics from the Server
Prometheus Metrics Definition
After integrating the metrics into Prometheus through either the OT Collector or Prometheus OLTP Receiver, you can refer to Prometheus Metrics▸ to view the metrics definitions.Option 1: Using OpenTelemetry Collector
- Start the OpenTelemetry Collector and configure the Prometheus Exporter to collect and export metrics data.
- When starting the Prometheus service, make sure to add the following configuration.
- Configure AutoMQ to push metrics data to the Collector.
Option 2: Using Prometheus OTLP Receiver
Integration into Self-Managed Open Source Prometheus
According to Prometheus’s version requirements, the user’s Prometheus service needs to meet the following conditions:- Prometheus version must be at least 2.47.
- Prometheus needs to enable feature flags: —enable-feature=otlp-write-receiver. Refer to the command below for enabling it.
If your current self-hosted Prometheus service is based on the VictoriaMetrics Enterprise edition, ensure that the version of VictoriaMetrics is at least 1.92.0. Configure the access point according to the relevant documentation on Sending Data via OpenTelemetry.