Skip to main contentThe AutoMQ team has set up a series of Grafana dashboard templates tailored to production environment scenarios. Once users export metrics to Prometheus, they can import these Grafana dashboard templates, configure the Grafana data source to link to the respective Prometheus, and begin monitoring AutoMQ.
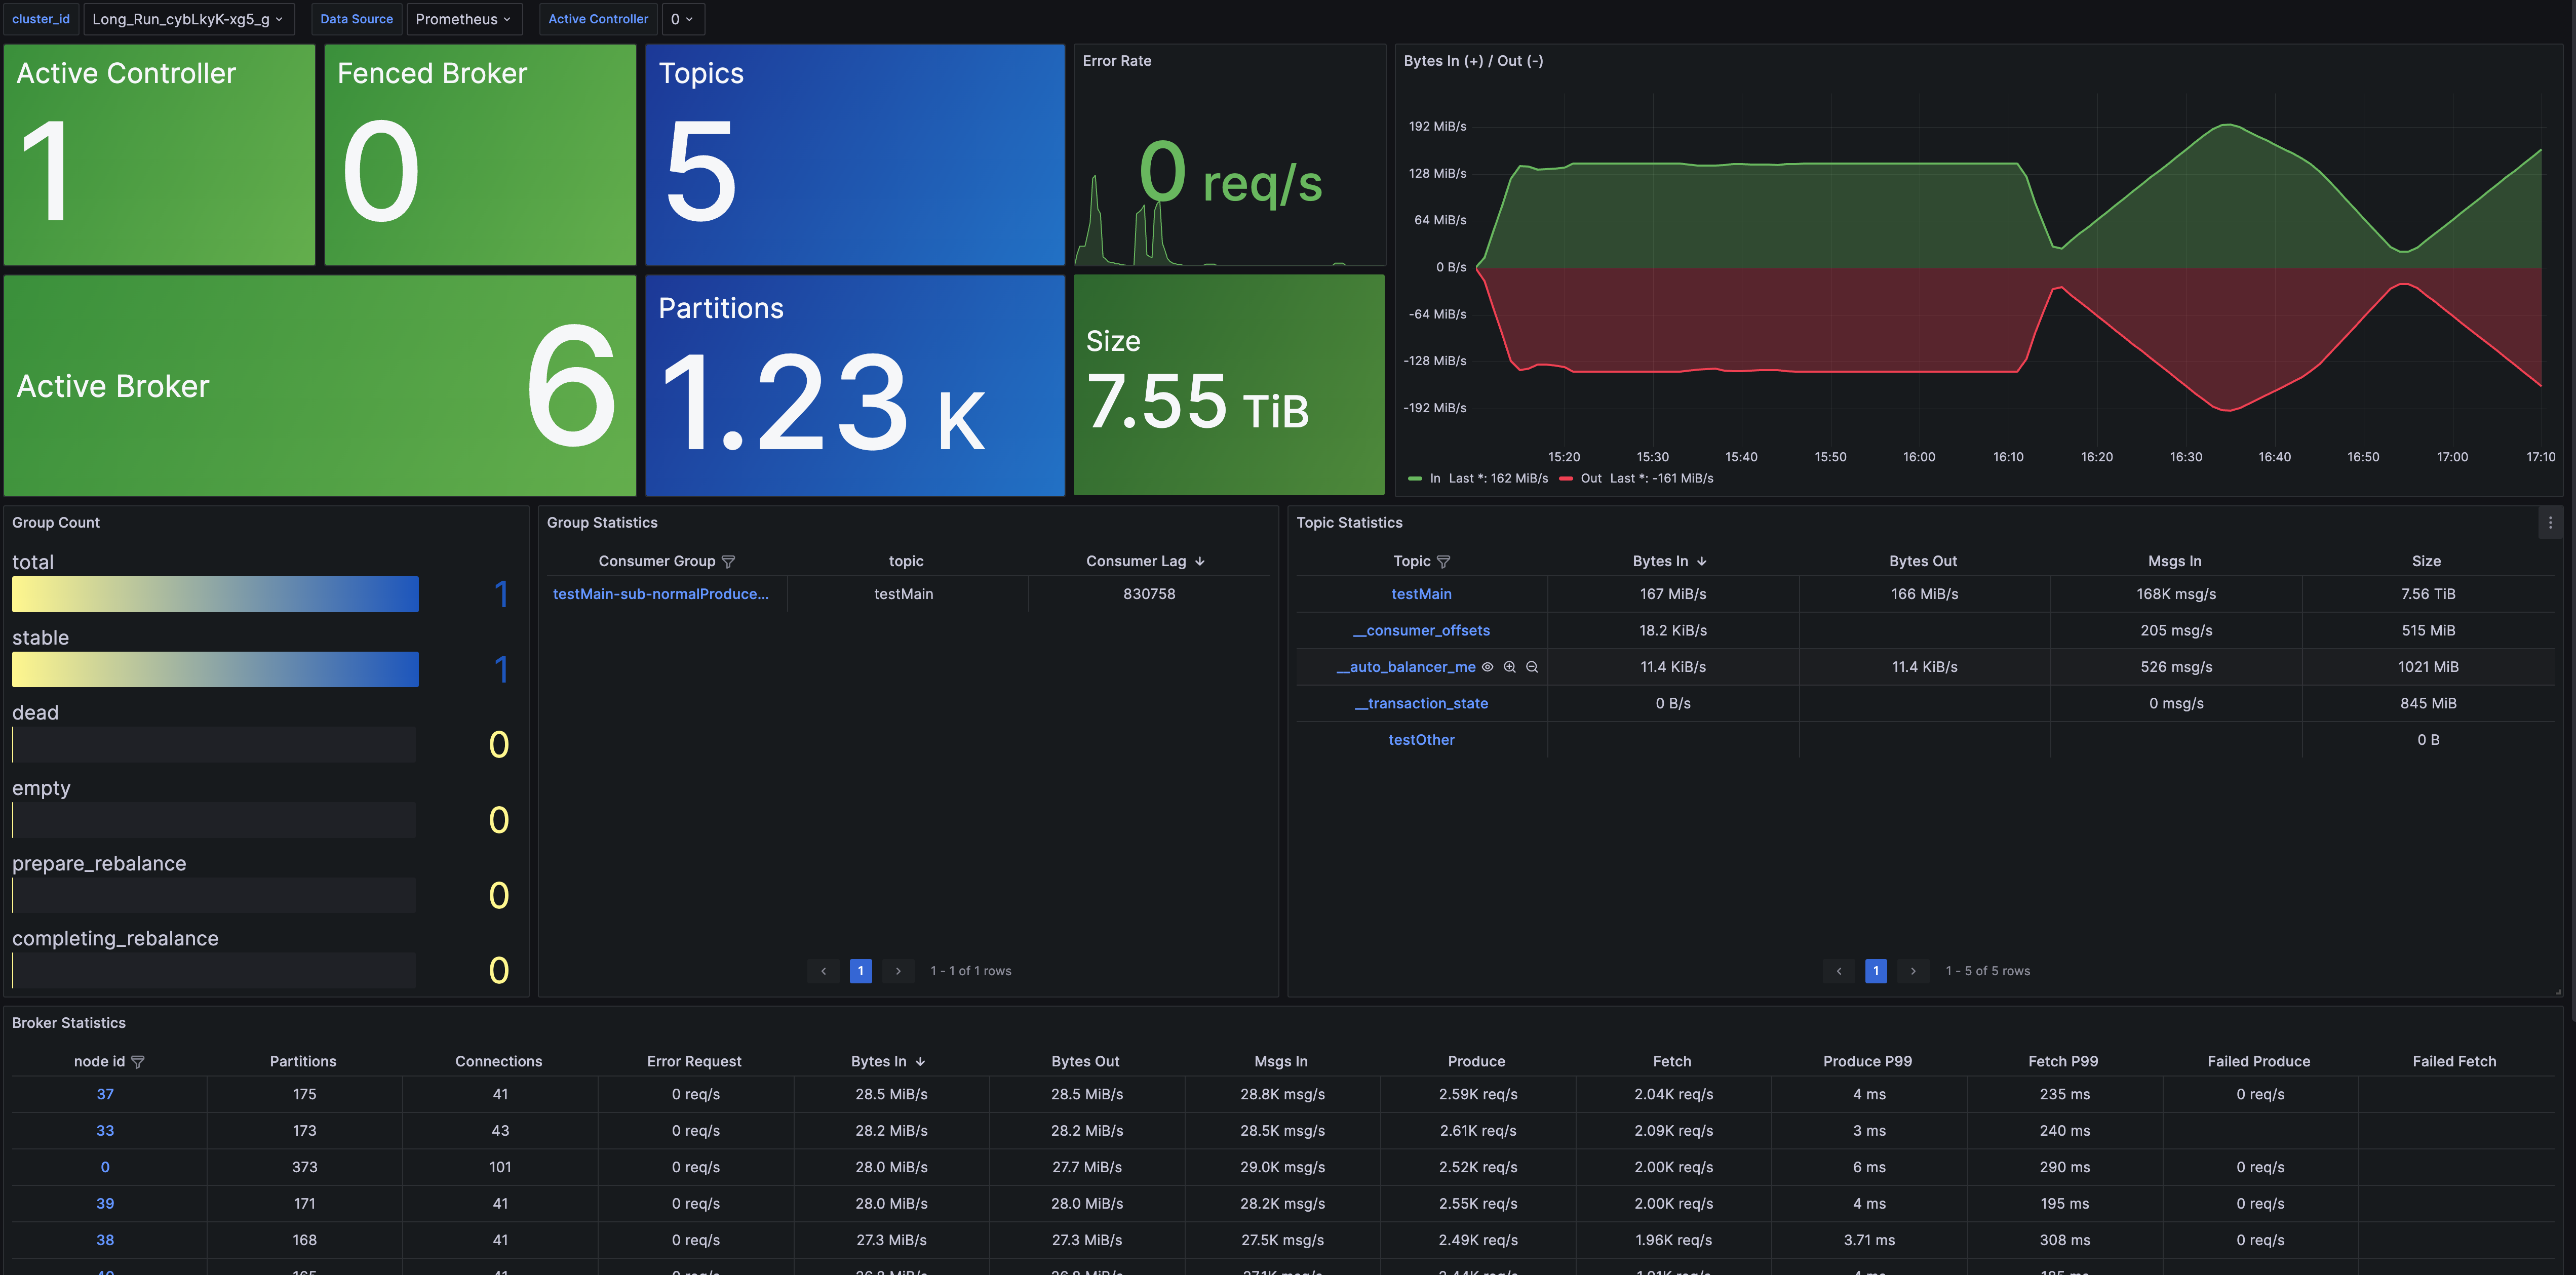
To obtain the Grafana dashboard template collection, you can reach out to the AutoMQ team by filling out the form. Cluster Overview
Cluster Overview provides monitoring information at the cluster level, including metrics like the number of nodes, data size, and cluster traffic. It also includes an overview with dimensions such as Topic, Group, and Broker, allowing users to delve into detailed monitoring information.
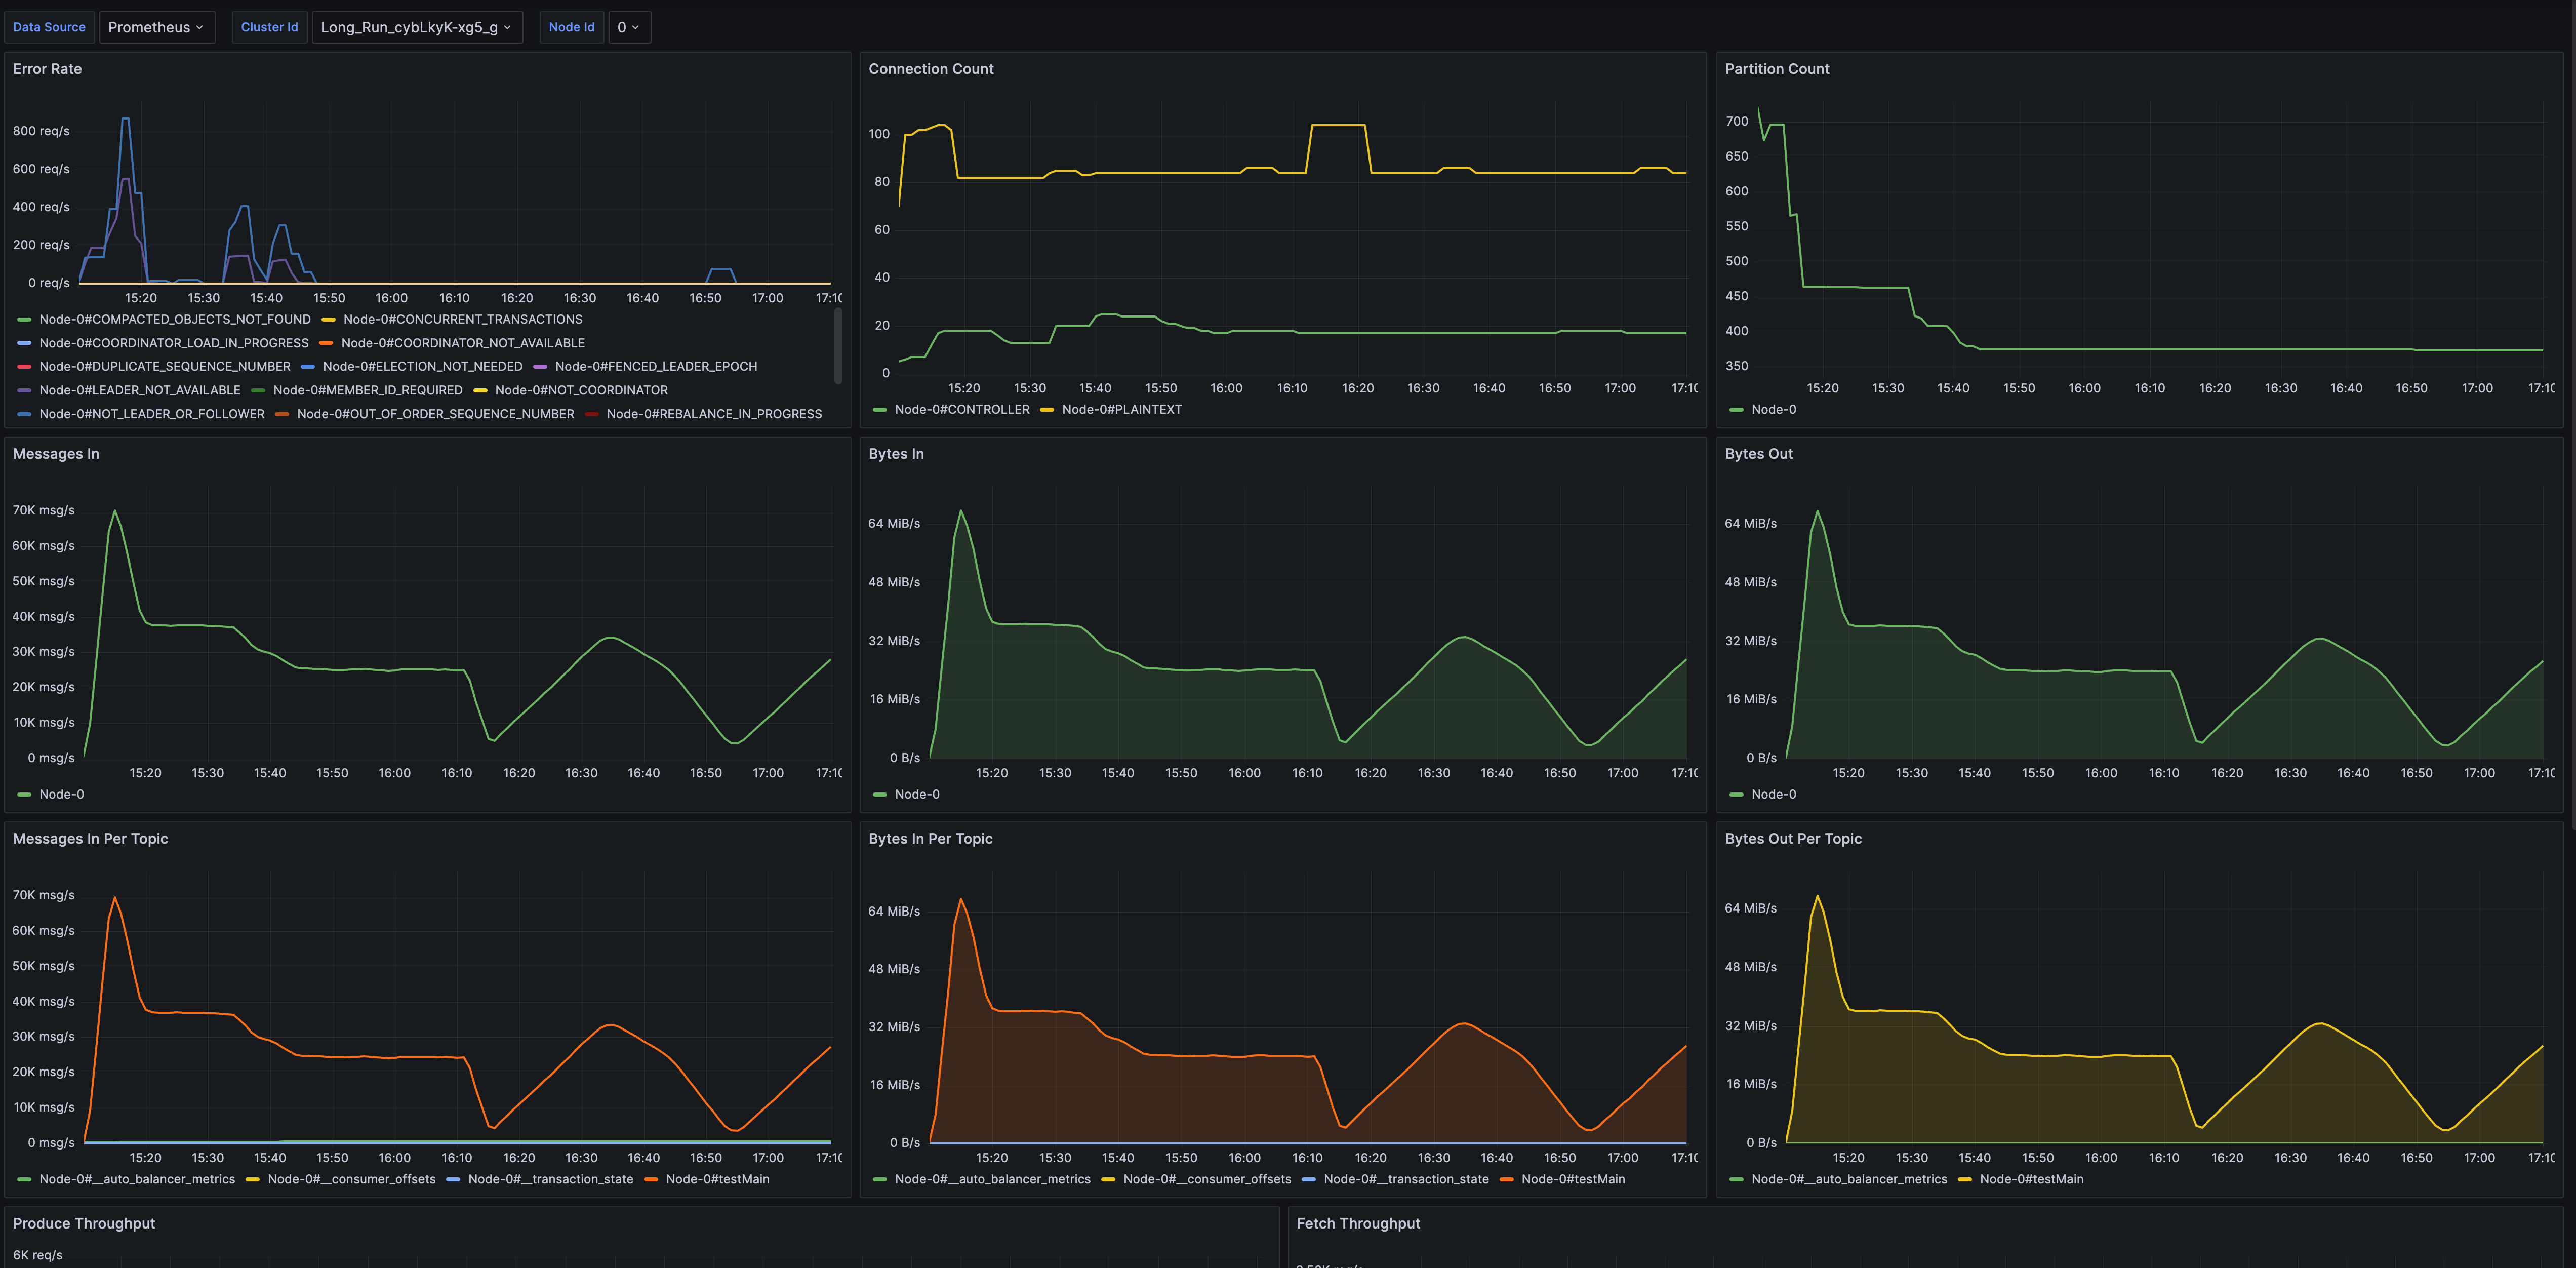
Broker Dashboard
Broker Metrics provides monitoring data for brokers, including metrics like connection count, partition count, node traffic, and node requests.
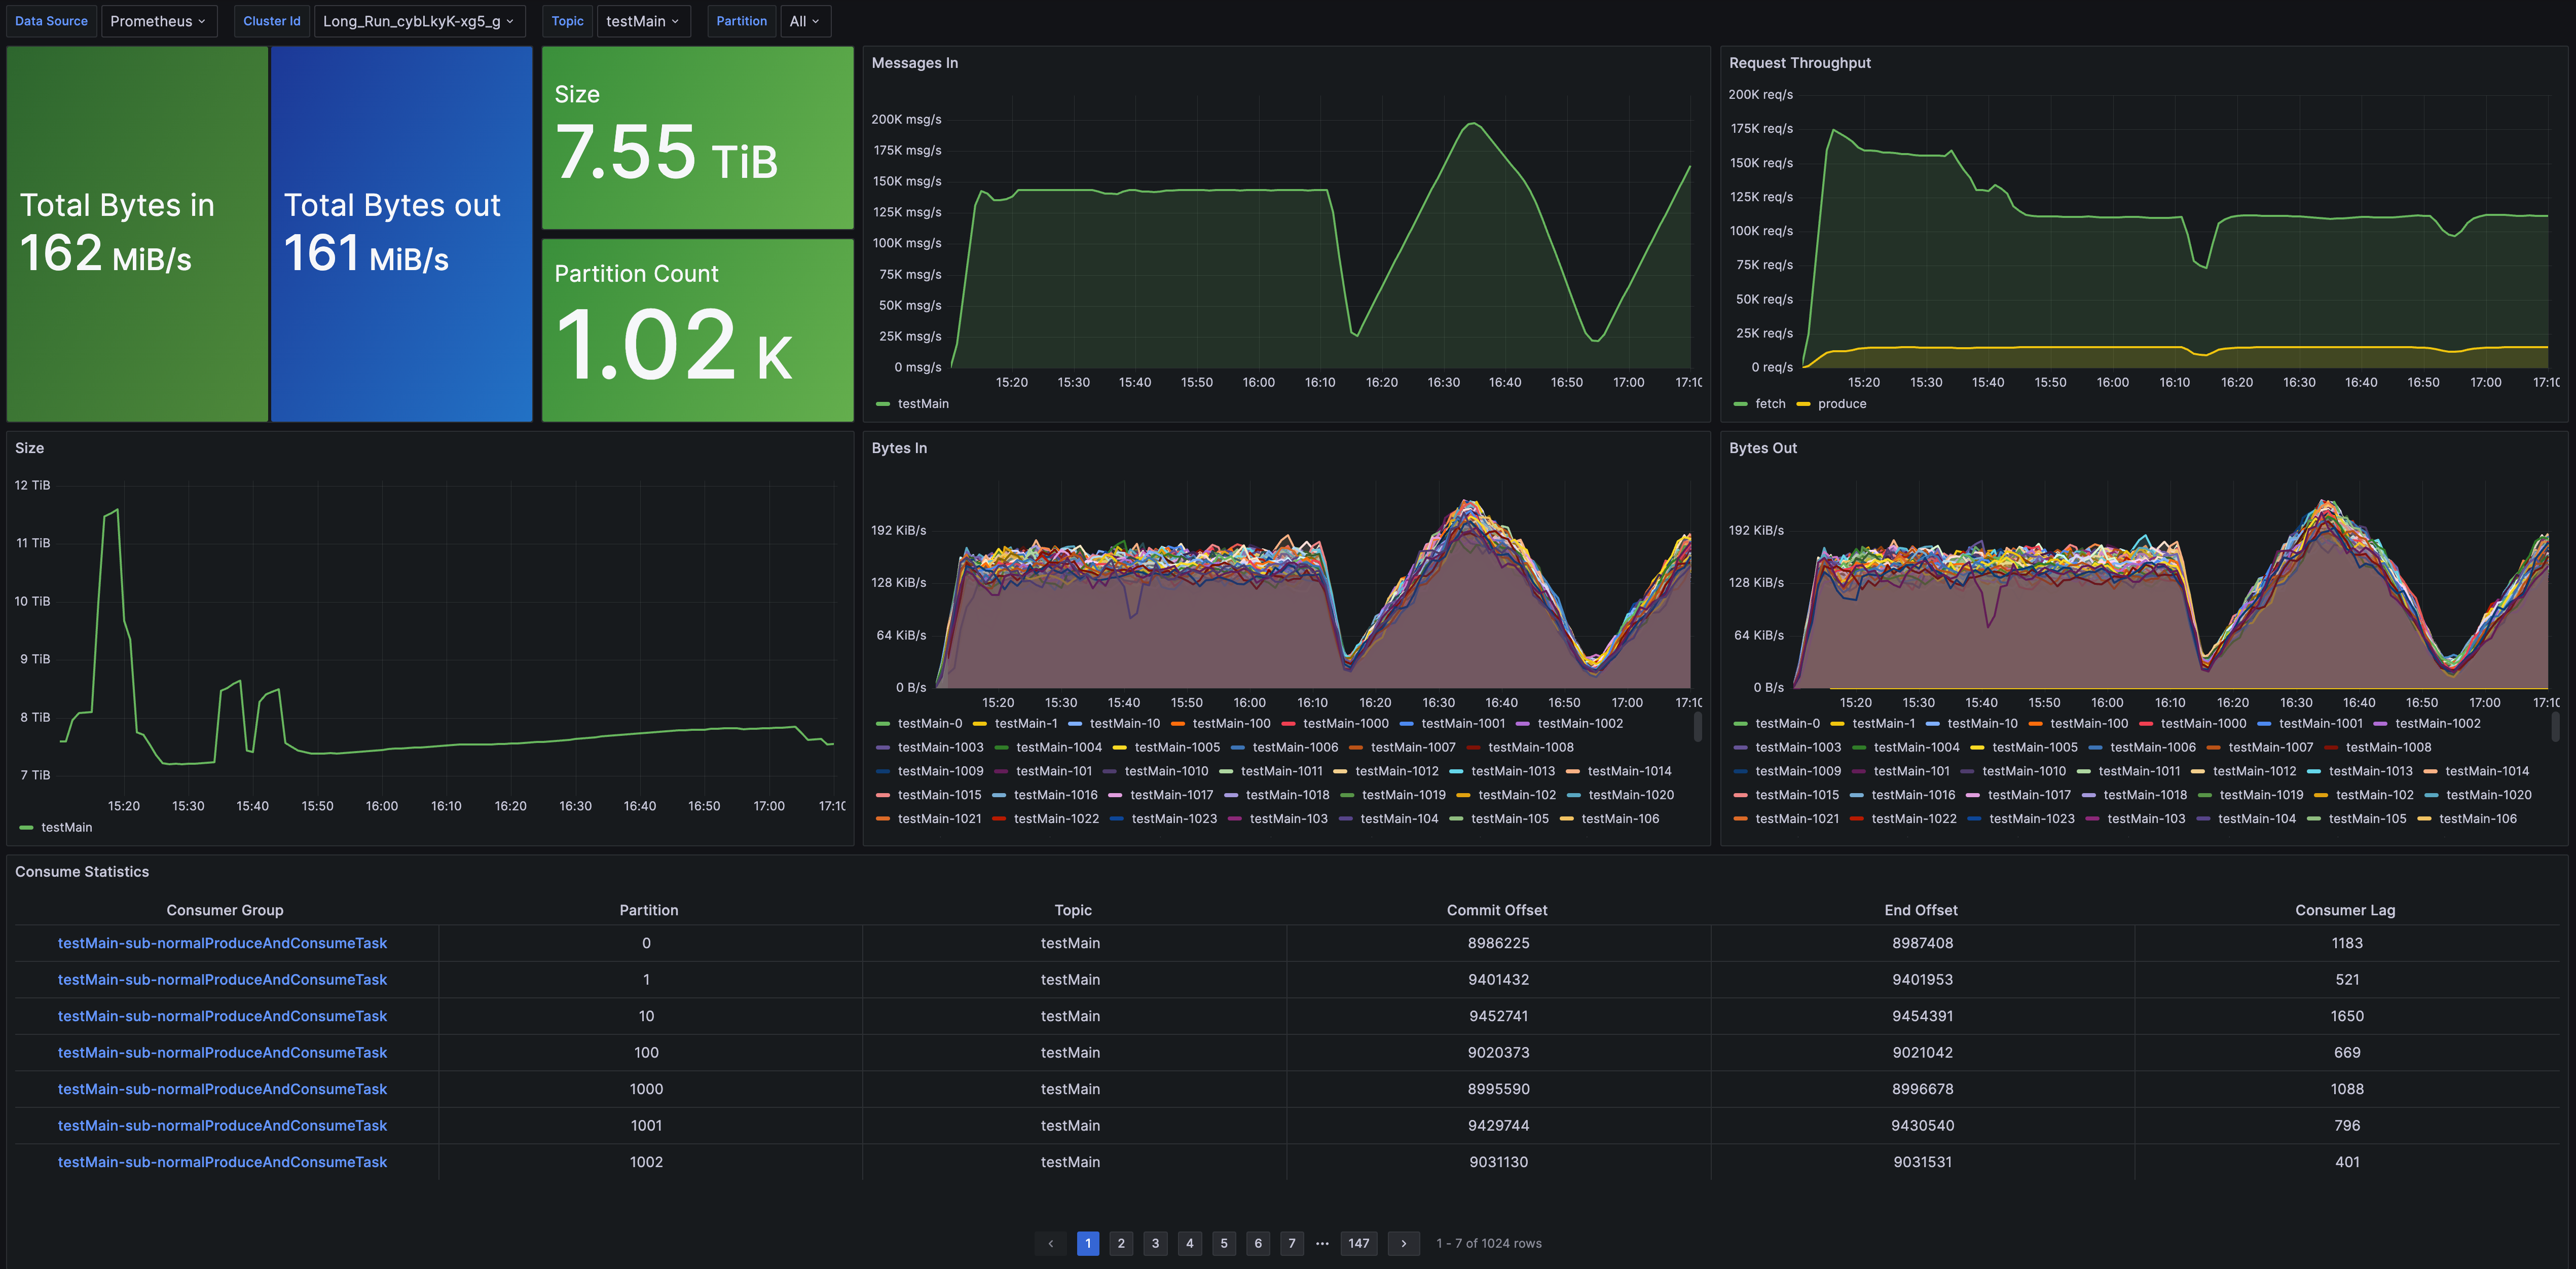
Topic Dashboard
Topic Metrics offers tailored monitoring for topics, covering metrics such as message throughput, total data volume, partition count, and consumption lag.
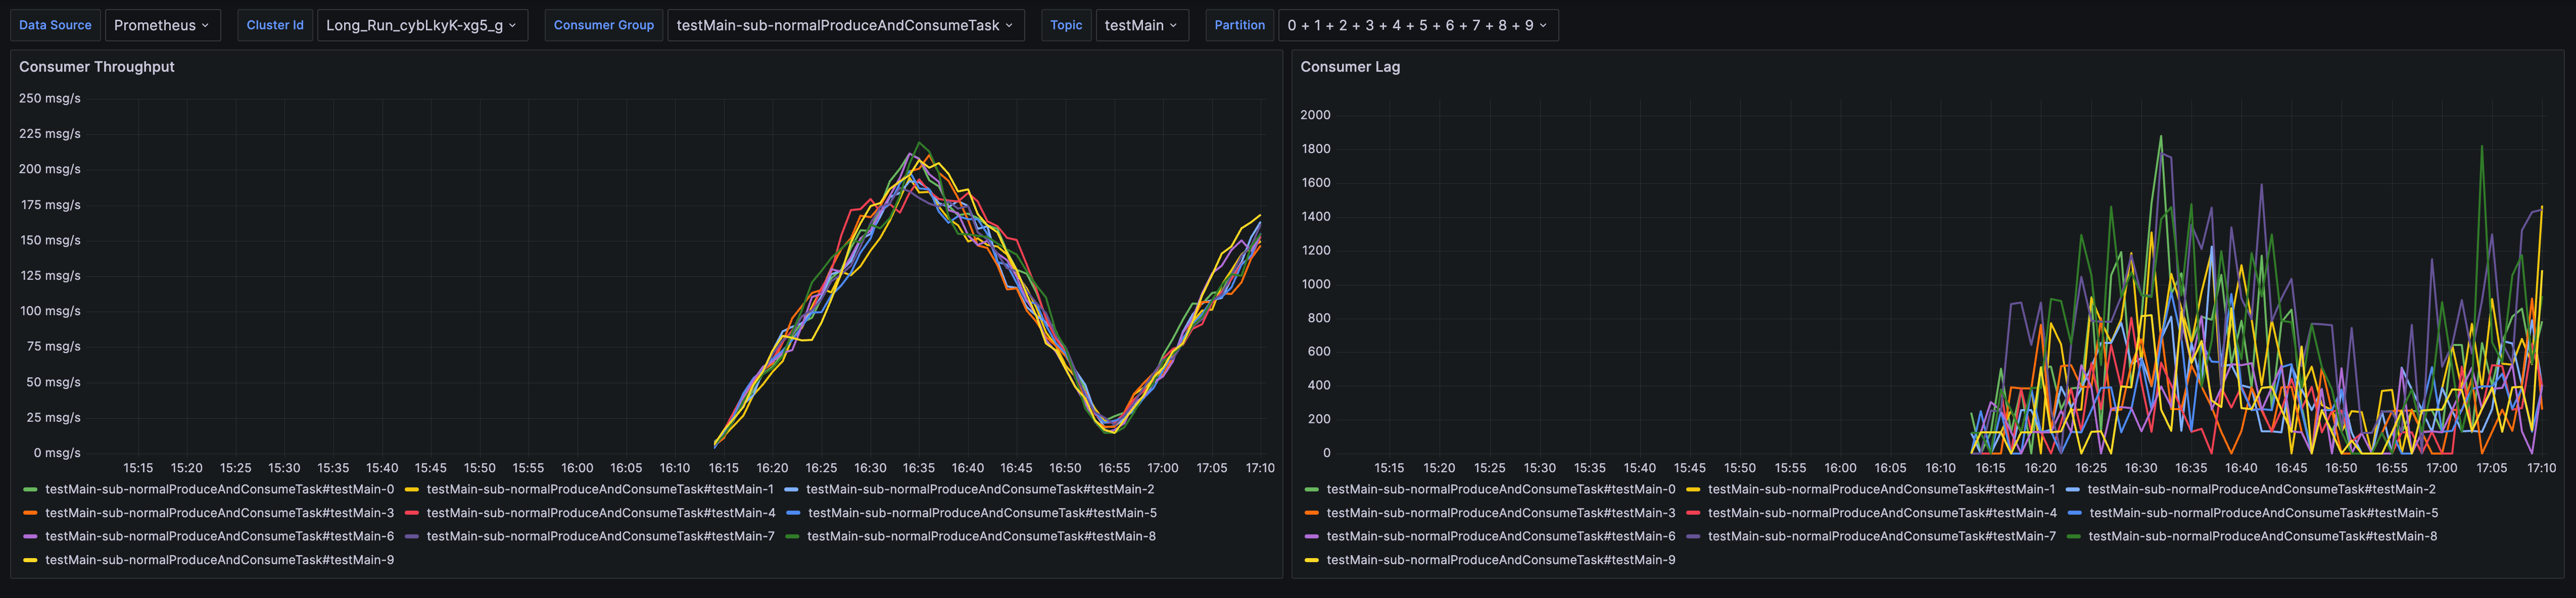
Group Dashboard
Group Metrics delivers monitoring indicators for groups, encompassing consumption rate and consumption latency.
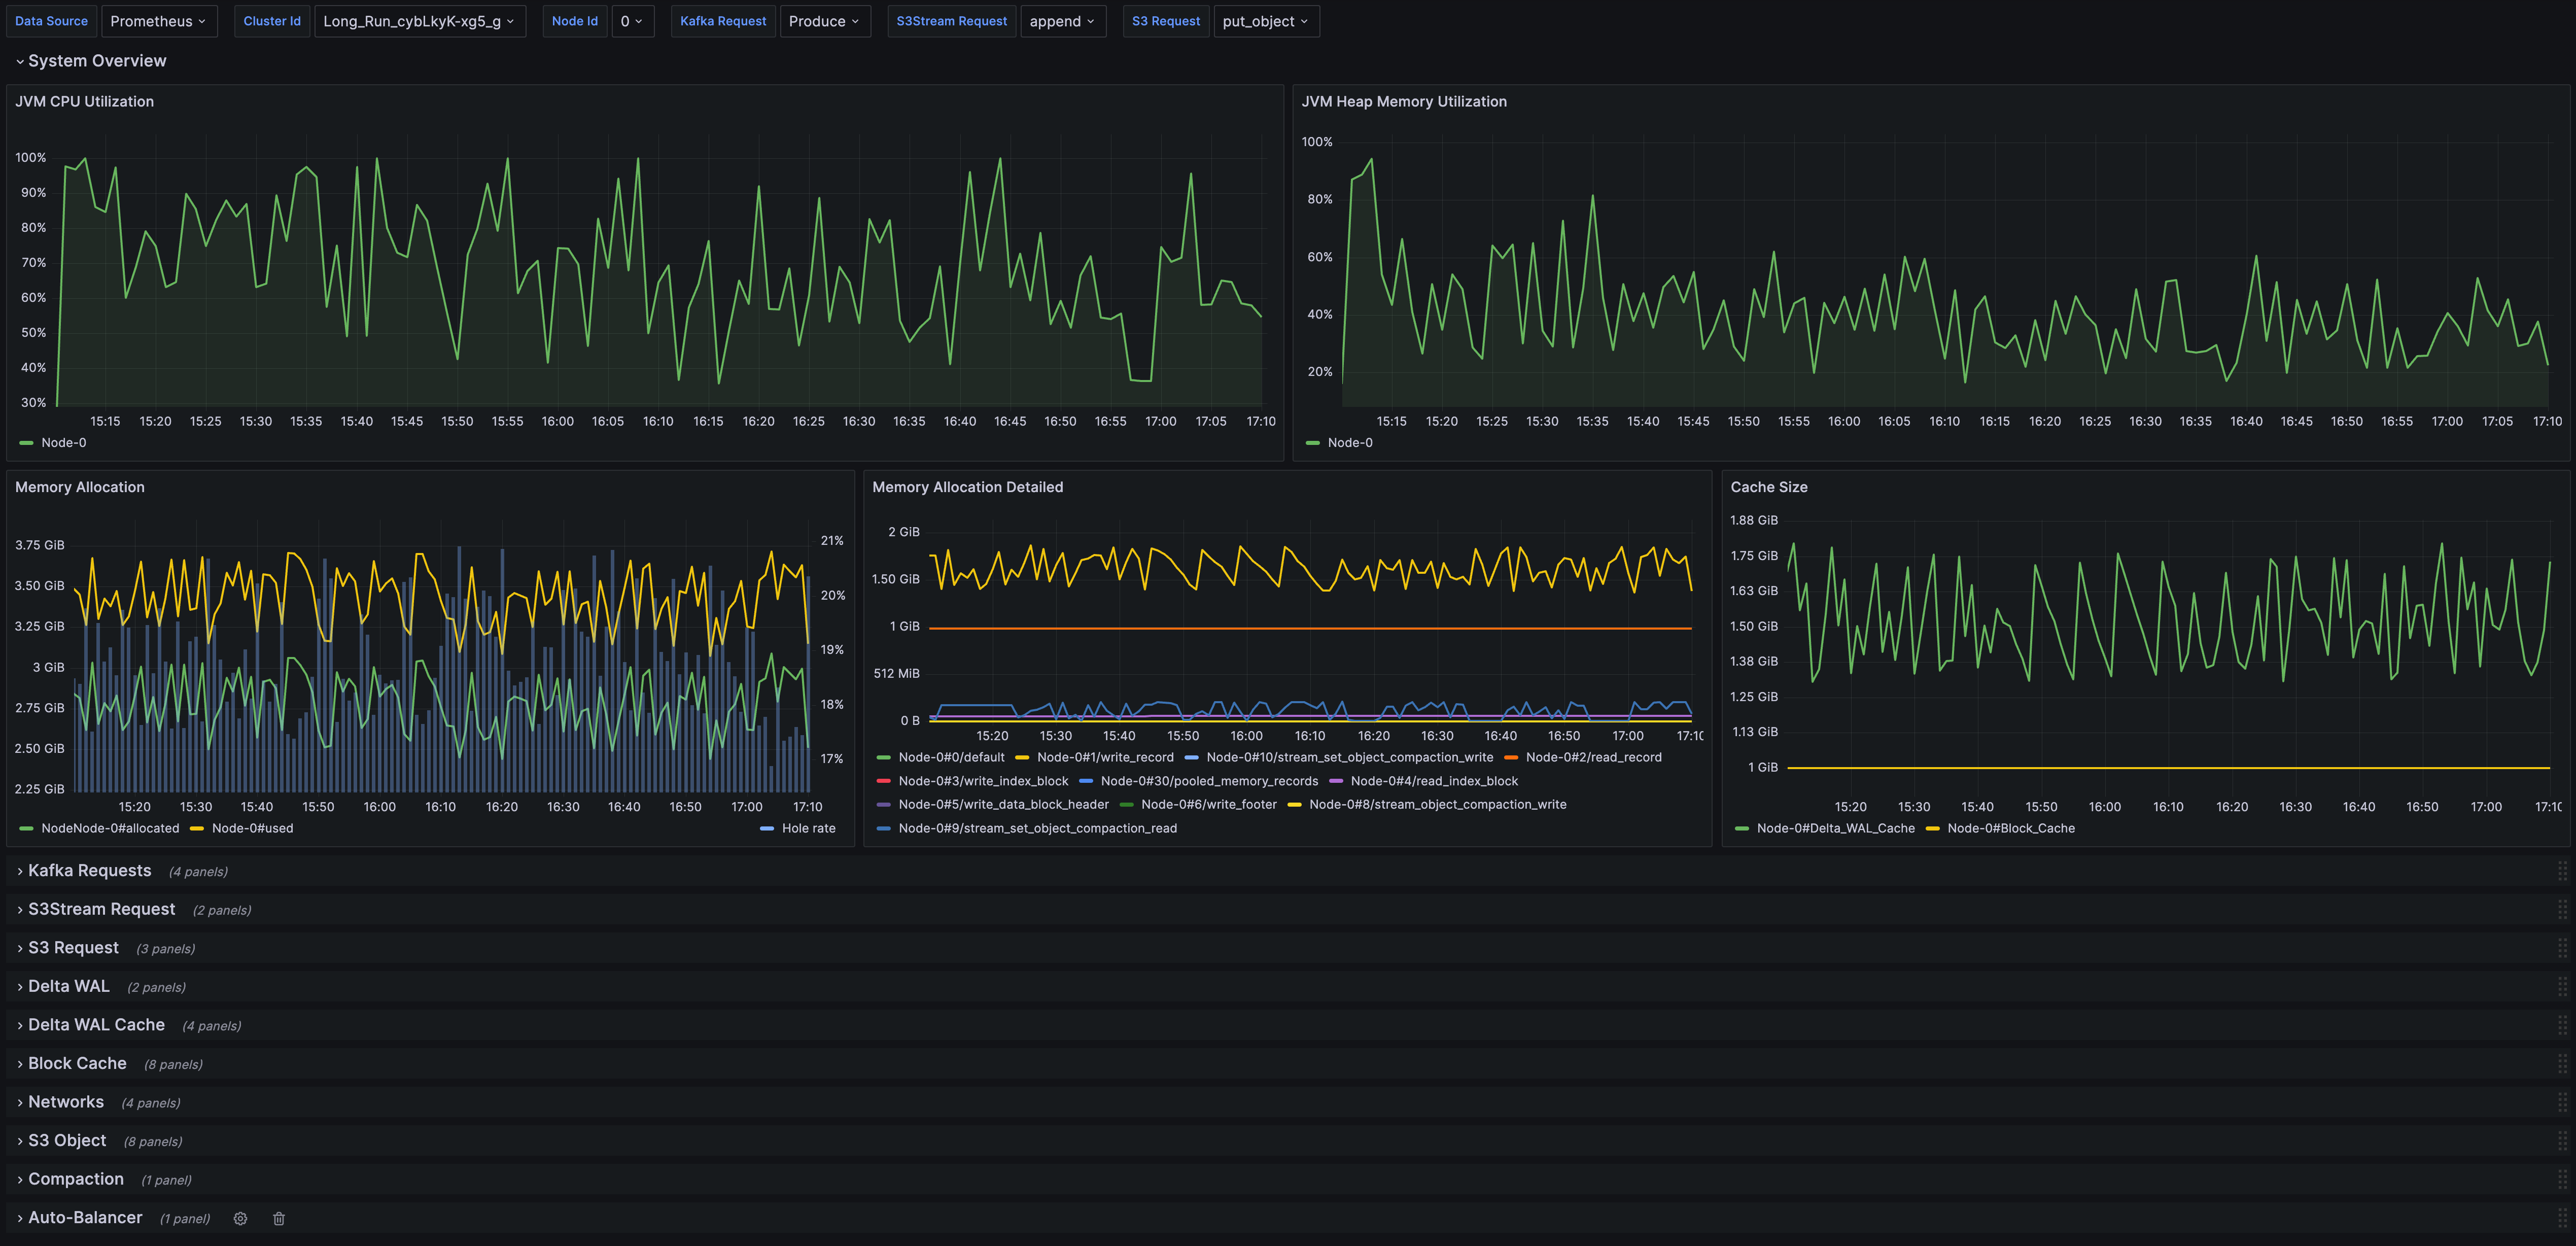
Detail Dashboard
Detailed Metrics provide a robust set of metrics at the implementation layer, allowing developers to effectively monitor, troubleshoot, and gain deeper insights into the operational mechanisms of AutoMQ.