Introduction
In modern enterprises, as the demand for data processing continues to grow, AutoMQ [1] emerges as a key component for real-time data processing due to its efficient and cost-effective stream processing capabilities. However, with the expansion of cluster scale and increased business complexities, ensuring the stability, high availability, and performance optimization of AutoMQ clusters becomes critically important. Thus, integrating a robust and comprehensive monitoring system is essential for maintaining the healthy operation of AutoMQ clusters. Prometheus[2], with its powerful data collection and querying capabilities, has become the ideal choice for monitoring AutoMQ clusters within enterprises. To address Prometheus’s limitations in large-scale data storage, VictoriaMetrics[3] serves as an efficient time-series database storage backend that provides enhanced storage and query performance. By integrating Prometheus and VictoriaMetrics, enterprises can achieve comprehensive monitoring of AutoMQ clusters, ensuring system high availability and performance optimization.AutoMQ Overview
AutoMQ is a cloud-reimagined stream processing system that maintains 100% compatibility with Apache Kafka while significantly enhancing cost efficiency and elasticity capabilities by offloading storage to object storage. Specifically, AutoMQ constructs a stream storage repository, S3Stream, built on S3, offloading storage to the shared cloud storage EBS and S3 provided by cloud vendors. This offers low-cost, low-latency, high-availability, high-reliability, and infinite capacity stream storage capabilities. Compared to traditional Shared Nothing architectures, AutoMQ adopts a Shared Storage architecture, significantly reducing storage and operational complexity while enhancing system elasticity and reliability. The design philosophy and technical advantages of AutoMQ make it an ideal choice for replacing existing Kafka clusters in enterprises. By adopting AutoMQ, enterprises can significantly reduce storage costs, simplify operations, and achieve automatic scaling and traffic self-balancing of clusters, thus efficiently responding to changes in business demands. Moreover, AutoMQ’s architecture supports efficient cold read operations and zero service interruption, ensuring stable operation under high load and sudden traffic conditions.
Prometheus Overview
Prometheus is an open-source system monitoring and alerting toolkit initially developed by SoundCloud and released as open source in 2012. It offers robust data collection, storage, and querying capabilities, enabling real-time monitoring of system and application performance metrics. Prometheus utilizes a multidimensional data model that uses labels to tag and query monitoring data, and it supports the flexible query language PromQL. The primary advantages of Prometheus include efficient data collection, strong query functionality, and a rich alerting mechanism, making it widely used in the cloud-native ecosystem. However, Prometheus has certain limitations in large-scale data storage, particularly when it comes to long-term storage and high-concurrency querying. Its storage performance and query efficiency may be affected. Consequently, integrating an efficient storage backend becomes essential to address these challenges.VictoriaMetrics Overview
VictoriaMetrics is a high-performance, open-source time-series database designed for high-concurrency data writing and querying. It features efficient data compression and storage capabilities, offering high throughput for data writes and queries with minimal hardware resource consumption. VictoriaMetrics supports Prometheus’ remote storage interface, allowing seamless integration into existing Prometheus monitoring systems. Below is an architecture diagram of VictoriaMetrics:![VictoriaMetrics Structure [4]](https://mintcdn.com/automq/HSGTYilF9PkMVbaa/automq/integrations/observability/prometheus/2.png?fit=max&auto=format&n=HSGTYilF9PkMVbaa&q=85&s=aab5c2731de8ba623bfa67e9a22b1604)
Prerequisites
- Deploy a functional AutoMQ node/cluster and open the Metrics collection port
- Deploy VictoriaMetrics as the storage backend for Prometheus
- Deploy Prometheus to retrieve Metrics data
Deploying AutoMQ, VictoriaMetrics, Prometheus
Deploying AutoMQ
Refer to the AutoMQ documentation: Deploy Multi-Nodes Cluster on Linux▸. Before starting deployment, add the following configuration parameters to enable Prometheus’s pull interface. Once the AutoMQ cluster is launched with these parameters, each node will additionally open an HTTP interface for retrieving AutoMQ monitoring metrics. These metrics comply with the Prometheus Metrics format.http://{node_ip}:8890, with the response example as follows:
Deploying VictoriaMetrics
Reference documentation: VictoriaMetrics [7]. VictoriaMetrics supports deployments via binary versions, Docker images, and source code. Here, we choose to deploy via Docker. Execute the following command to start the VictoriaMetrics container and map the data files to the folder/home/VictoriaMetrics/data for easy monitoring of data import changes:
http://{client_ip}:8428 in a browser.
Deploying Prometheus
Prometheus can be deployed by downloading the binary package or using Docker. Below is an introduction to both deployment methods.Binary Deployment
For ease of use, you can create a new script and modify the Prometheus download version as needed. After creating the script, simply execute it to complete the deployment. First, create a new script:client_ip to the address exposed by AutoMQ for observable data.
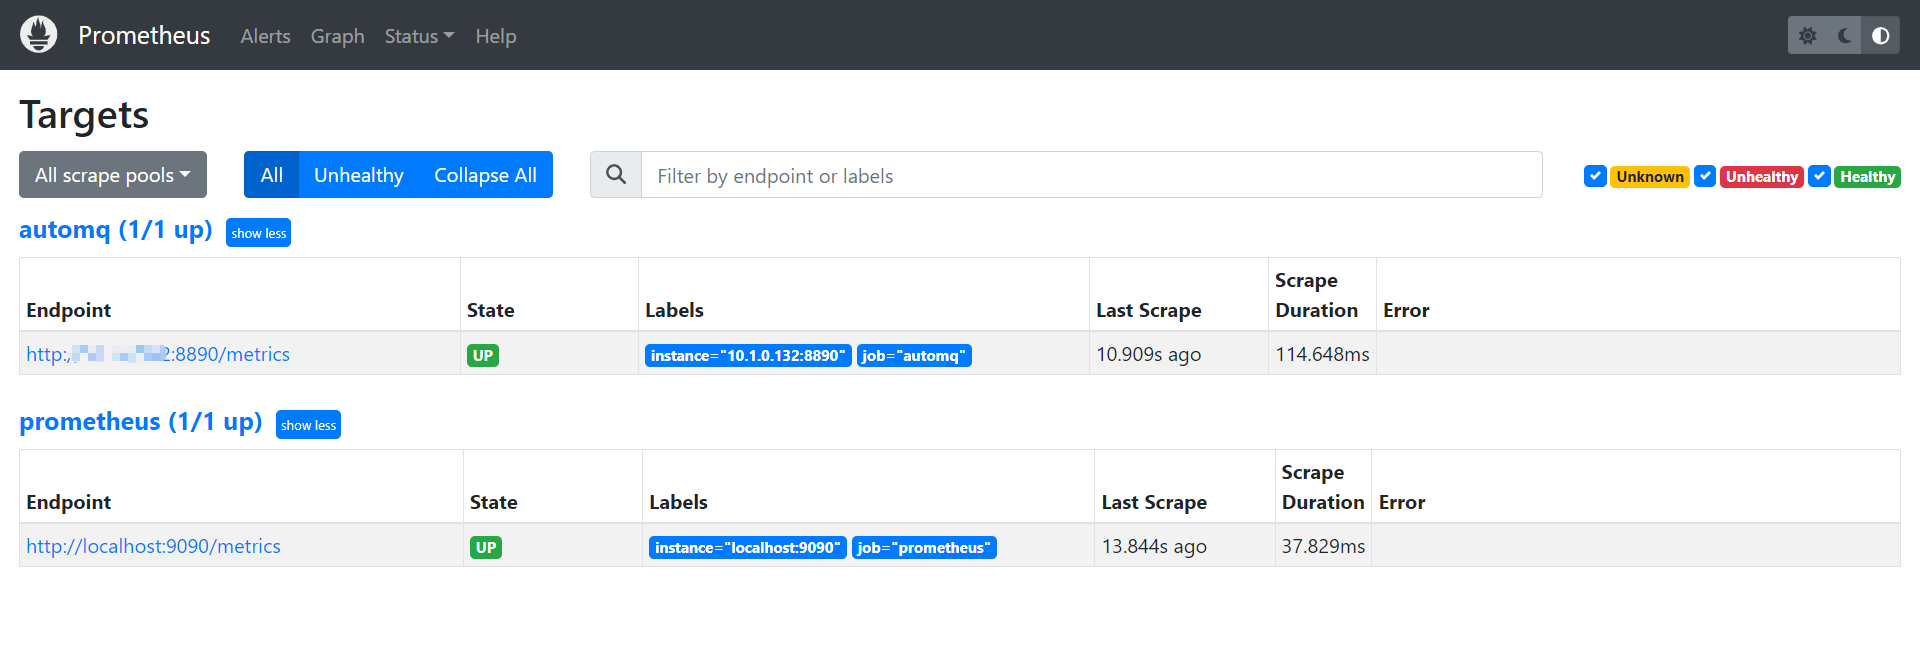
http://{client_ip}:9090/targets.
Docker Deployment
If you currently have a running Prometheus Docker container, execute the command to remove the container first:Check the Integration Results.
VictoriaMetrics Data Verification
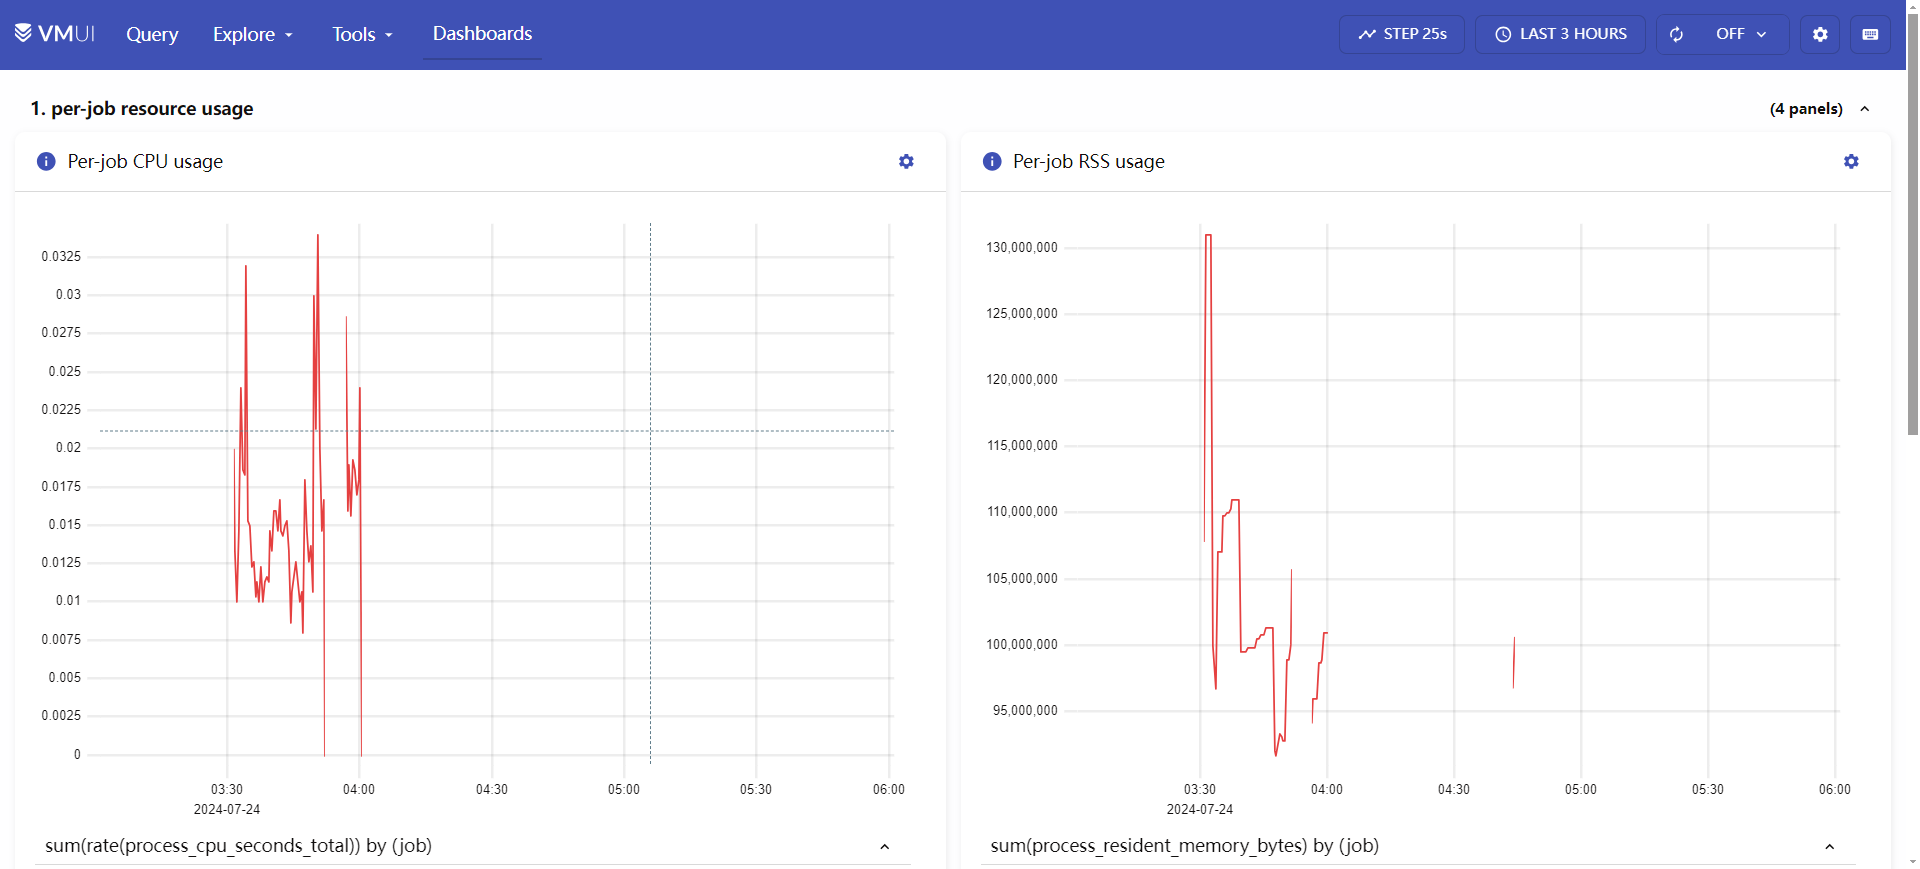
VictoriaMetrics offers a Dashboard accessible viahttp://{client_ip}:8428/vmui, where the initial display is:
http://{client_ip}:8428/api/v1/status/tsdb, you can obtain a JSON file:
Grafana Dashboard (Optional)
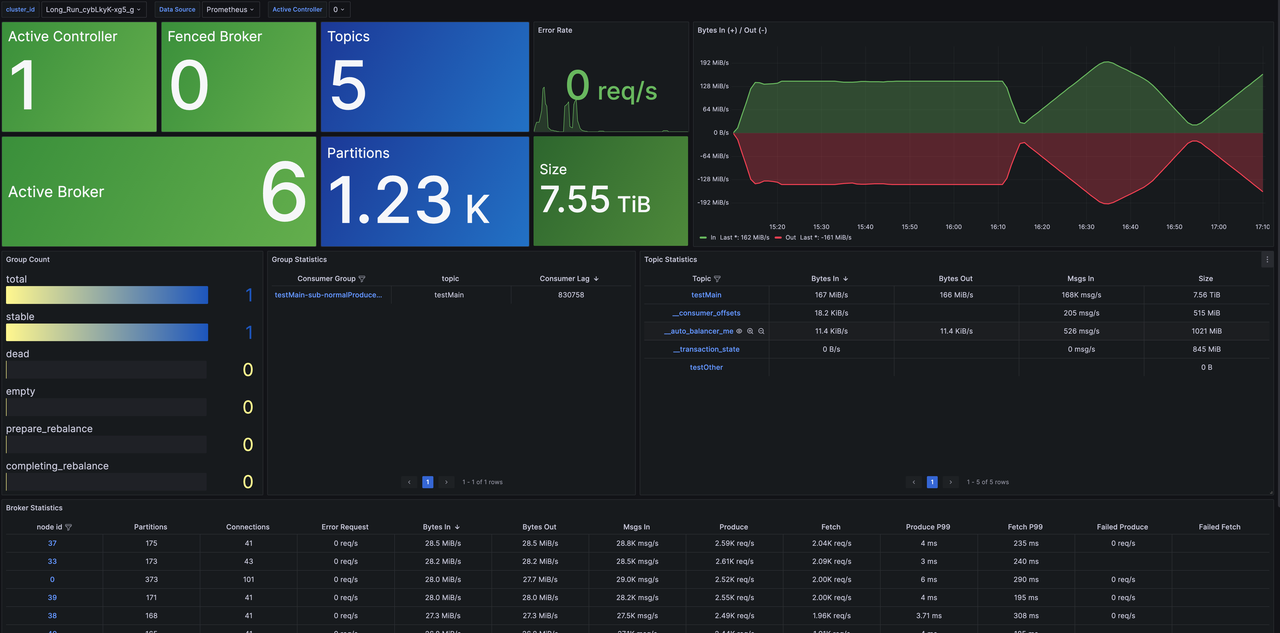
Since we have used VictoriaMetrics as Prometheus storage, we can configure it as a data source for Grafana athttp://{client_ip}:8428, to access the status information of the AutoMQ cluster. For Grafana template files, you can refer to the official AutoMQ templates: grafana [9]. The final demonstration output is as follows:
Cluster Overview: Provides cluster-level monitoring information, including metrics like the number of nodes, data size, and cluster traffic. Additionally, it offers an overview of dimensions such as Topic, Group, and Broker, with support for drill-down functionality to examine detailed monitoring information.
Summary
In this article, we have thoroughly examined how to integrate AutoMQ, Prometheus, and VictoriaMetrics to enable comprehensive monitoring of AutoMQ clusters. We began by introducing the functions and advantages of each component, explaining why Prometheus was chosen as the monitoring system and why VictoriaMetrics is essential as the storage backend for Prometheus. Next, we offered step-by-step guidance on deploying and configuring AutoMQ, VictoriaMetrics, and Prometheus, and confirmed the effectiveness of this integration. With this integration approach, enterprises can gain the following benefits:- Efficient data collection and storage: Prometheus handles efficient data collection, while VictoriaMetrics provides efficient data storage and compression capabilities, ensuring that the system can store large-scale time-series data with minimal hardware resource consumption.
- Fast data querying: VictoriaMetrics offers rapid data query performance to meet high concurrent query demands, ensuring efficient queries in scenarios involving large-scale data storage.
- Seamless Integration: VictoriaMetrics supports Prometheus’ remote storage interface, enabling smooth integration with existing Prometheus monitoring systems and enhancing the overall performance and stability of such systems.