Preface
Guance Cloud
Observing Cloud [1] is a unified real-time monitoring application designed for cloud platforms, cloud-native environments, applications, and business-related needs. It integrates three major signals: metrics, logs, and tracing, covering testing, prerelease, and production environments to achieve observability throughout the software development lifecycle. Through Observing Cloud, enterprises can build complete application full-link observability, enhancing the overall transparency and controllability of the IT architecture. As a powerful data analytics platform, Guance Cloud includes several core modules, such as DataKit [2], a unified data collector, and the DataFlux Func data processing development platform.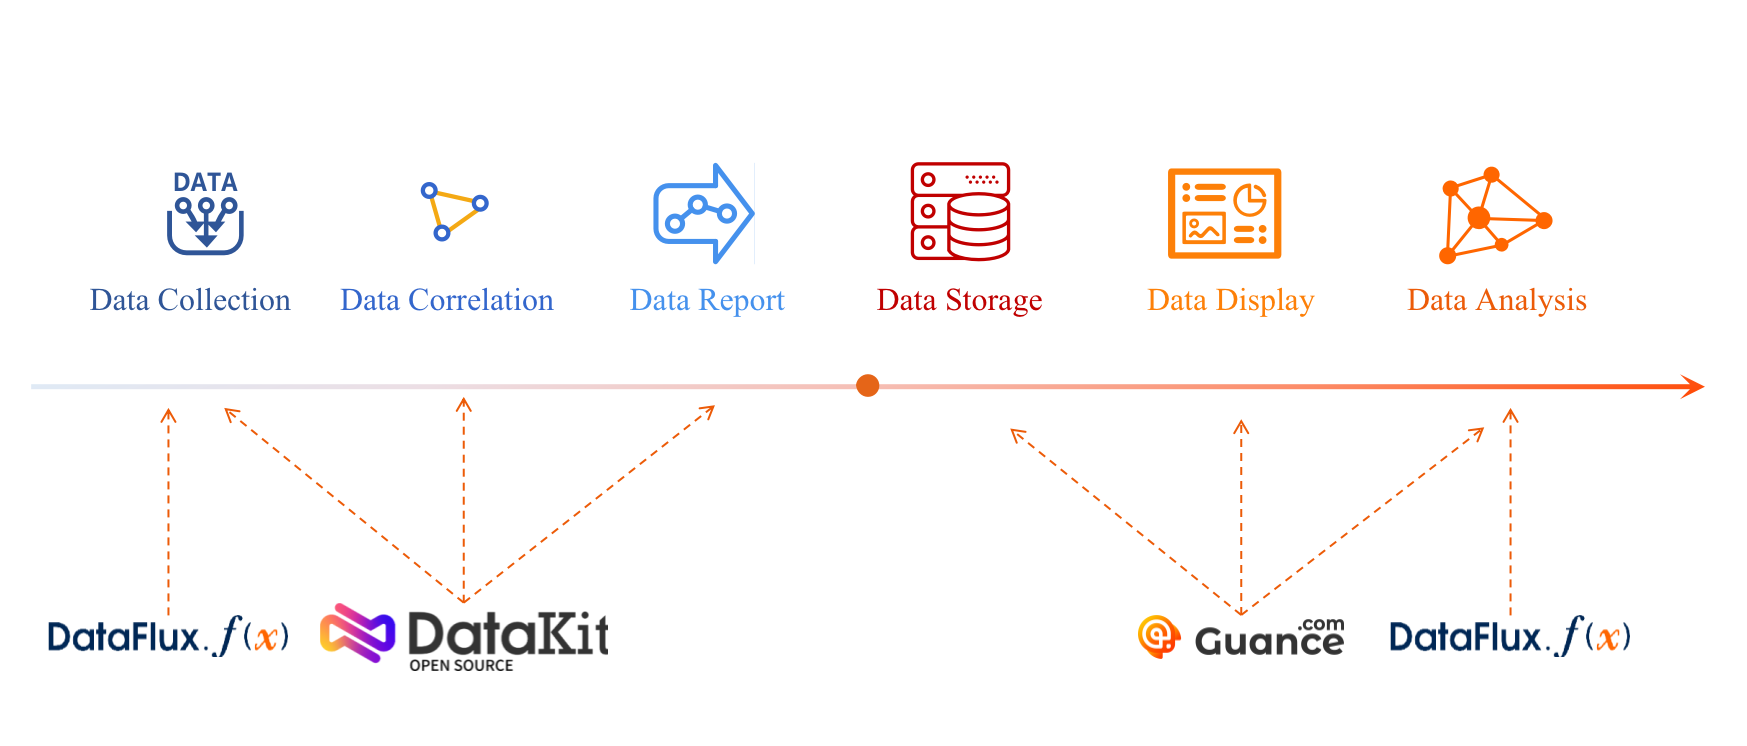
AutoMQ
AutoMQ [3] is a new generation of Apache Kafka® distribution redesigned based on cloud-native concepts. It provides up to 10 times cost and elasticity advantages while being 100% compatible with the Apache Kafka protocol. AutoMQ stores data entirely on S3, allowing for rapid response to sudden traffic spikes without the need for data replication during cluster expansion. In contrast, Apache Kafka requires significant bandwidth for partition data replication after scaling, making it difficult to handle sudden traffic. AutoMQ achieves high system autonomy through features like automatic scaling, self-balancing, and automatic fault recovery, achieving higher availability without human intervention. AutoMQ’s shared storage architecture:
Observability Interfaces of AutoMQ
Due to AutoMQ’s full compatibility with Kafka and support for open Prometheus-based metrics collection ports, the data collection tool DataKit provided by Observing Cloud can be integrated with the Observing Cloud platform. This facilitates users to monitor and manage the state of AutoMQ clusters. Additionally, the Observing Cloud platform supports user-defined aggregation and querying of metrics data. By using predefined dashboard templates or custom dashboards, various statistics of the AutoMQ cluster, such as common topics, brokers, partitions, and group statistics, can be effectively summarized. Furthermore, based on metrics observability data, it is also possible to query error conditions encountered during the operation of the AutoMQ cluster and various utilization metrics of the current system, such as JVM CPU usage, JVM heap usage, and cache size. These metrics can help quickly identify and resolve issues when anomalies occur in the cluster, which is very beneficial for high availability and rapid recovery of the system. Next, this article will introduce how to use the Observing Cloud platform to monitor the state of the AutoMQ cluster.Steps to Integrate with Observation Cloud
Enable Metric Fetching Interface in AutoMQ
Refer to the AutoMQ documentation: Deploy Multi-Nodes Cluster on Linux▸ Before starting the deployment, add the following configuration parameters to enable Prometheus pull interfaces. After starting the AutoMQ cluster with these parameters, each node will further expose an HTTP interface for pulling AutoMQ monitoring metrics. The format of these metrics follows the Prometheus Metrics format.http://{node_ip}:8890. An example of the response is as follows:
Install and Configure DataKit Collection Tool
DataKit is an open-source monitoring collection tool provided by Observing Cloud that supports Prometheus metrics scraping. You can use DataKit to pull monitoring data from AutoMQ and aggregate it to the Observing Cloud platform.Install the DataKit Tool
Tips: For more details on DataKit installation, refer to the documentation: Host Installation - Guance Documentation [6].First, register for a Guance account and log in. Then, in the main interface, click “Integration” on the left side and select “DataKit” at the top to see the DataKit installation command.
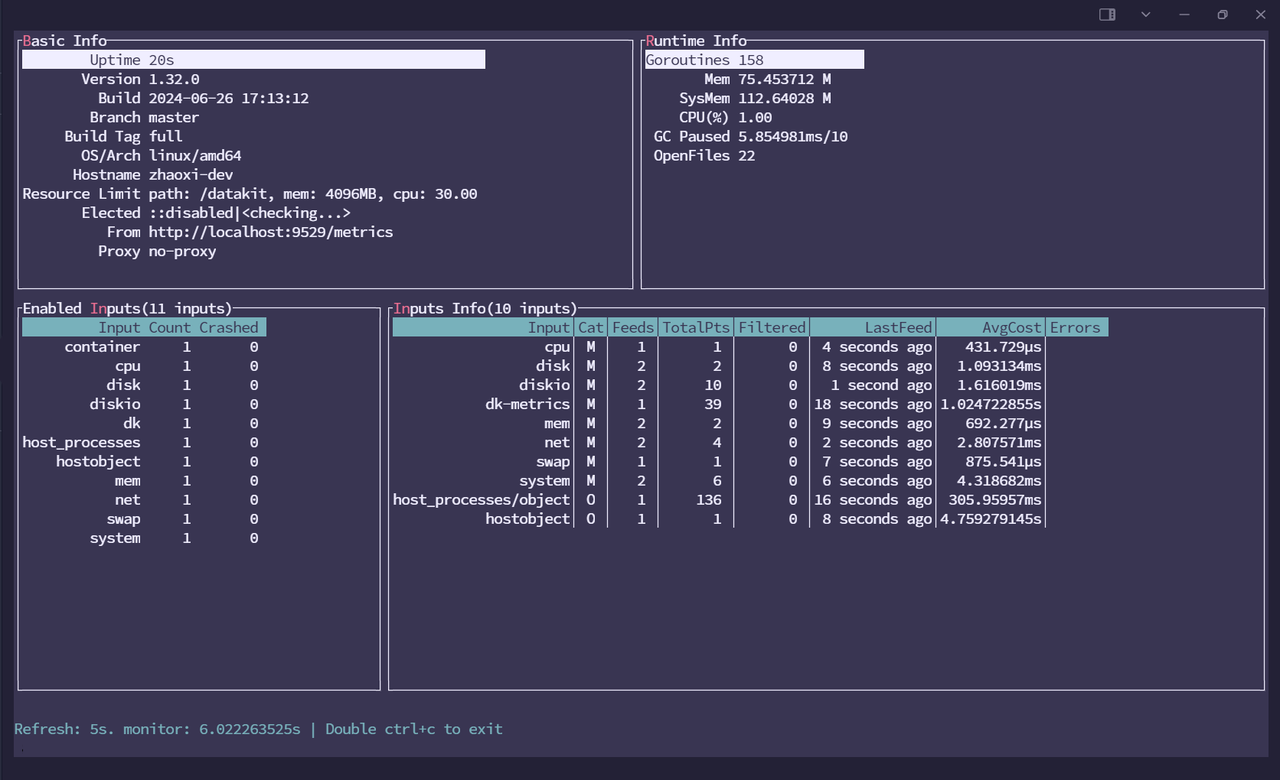
Tips: DataKit needs to be installed on all Brokers in the cluster that need to be monitored.After successfully executing the installation command, use the command
datakit monitor to verify if DataKit is successfully installed.
AutoMQ Collector Configuration and Activation
Here, you need to configure the DataKit AutoMQ collector on the server of each node where data is to be collected. Enter the directory/usr/local/datakit/conf.d/prom and create a collector configuration file prom.conf. The collector configuration will include the open observable data interfaces, collector name, prom instance name, and important collection interval, etc. You can make some adjustments to the configuration on each server as needed:
| urls | AutoMQ metrics address, provide the corresponding metrics URL exposed by the component here |
|---|---|
| source | Collector alias, it is recommended to distinguish it |
| interval | Collection interval, specifies the interval at which the collector collects data |
datakit service -R to restart the DataKit on that node to activate the collector configuration.
Monitor AutoMQ Clusters Via GUI-Based Management
The monitoring platform has integrated AutoMQ and provides multiple default dashboards. You can view the Dashboard Examples[7]. Below are examples of several commonly used templates, and we will introduce their functions:Cluster Monitoring
The main display shows the number of currently active Brokers, the total number of Topics, Partitions, etc. Additionally, you can specify which node to query specifically by selecting in the Cluster_id.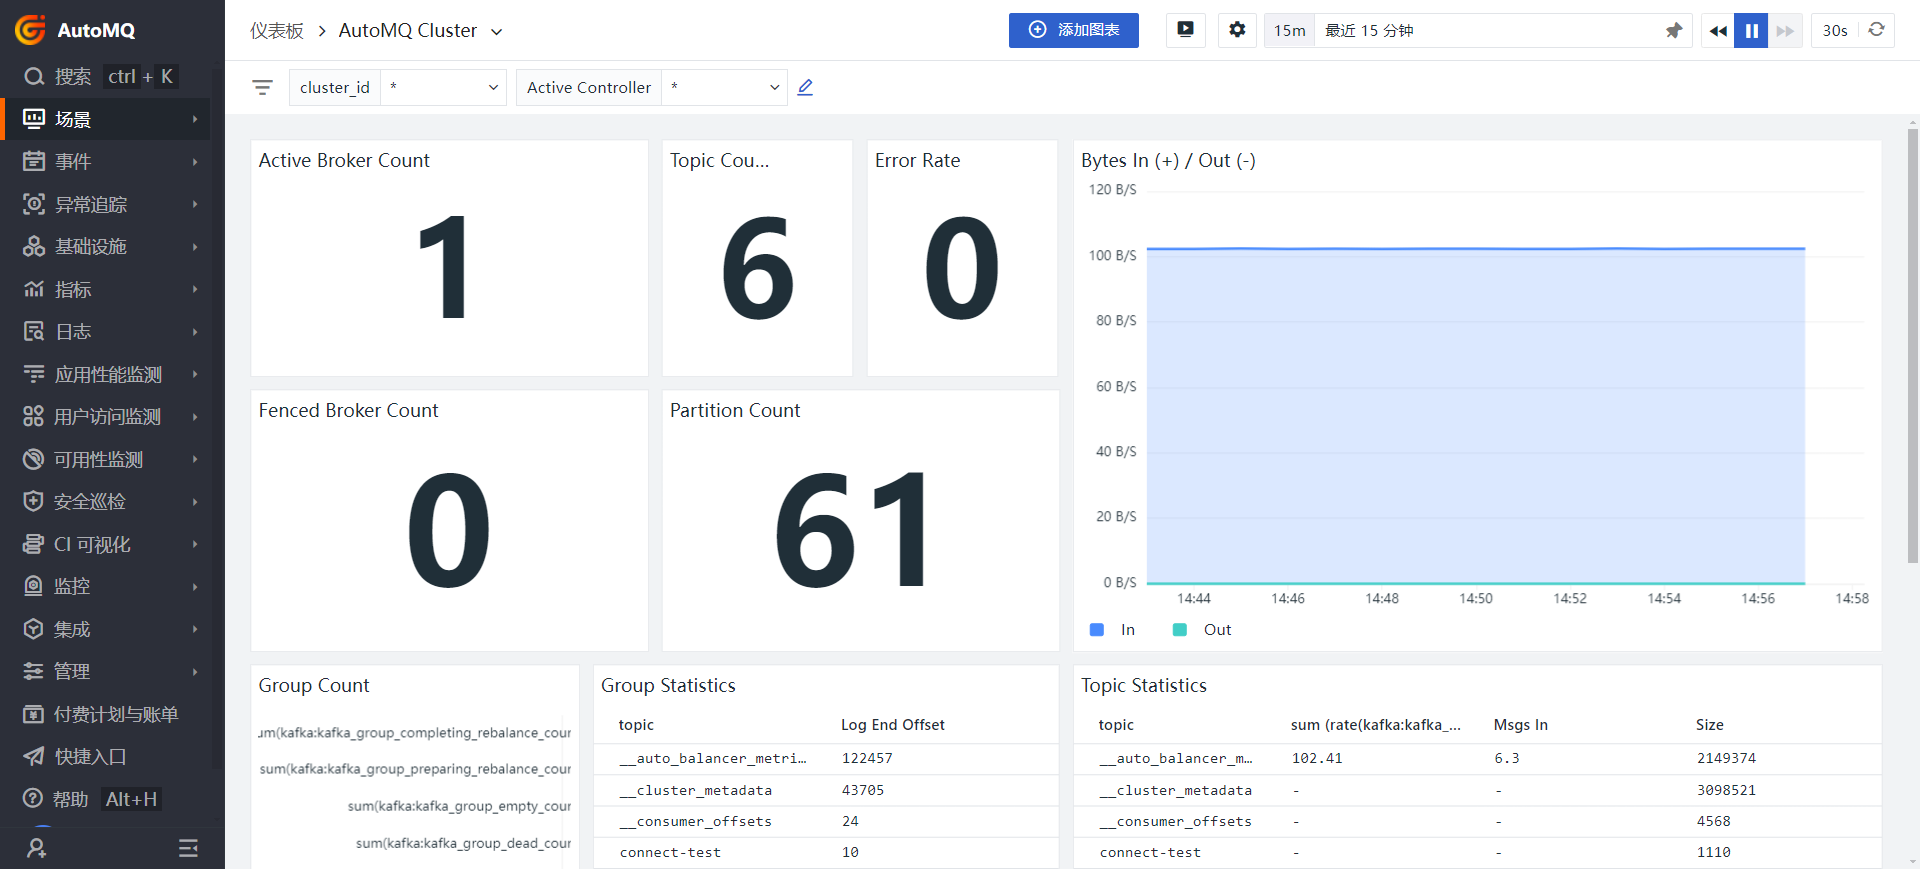
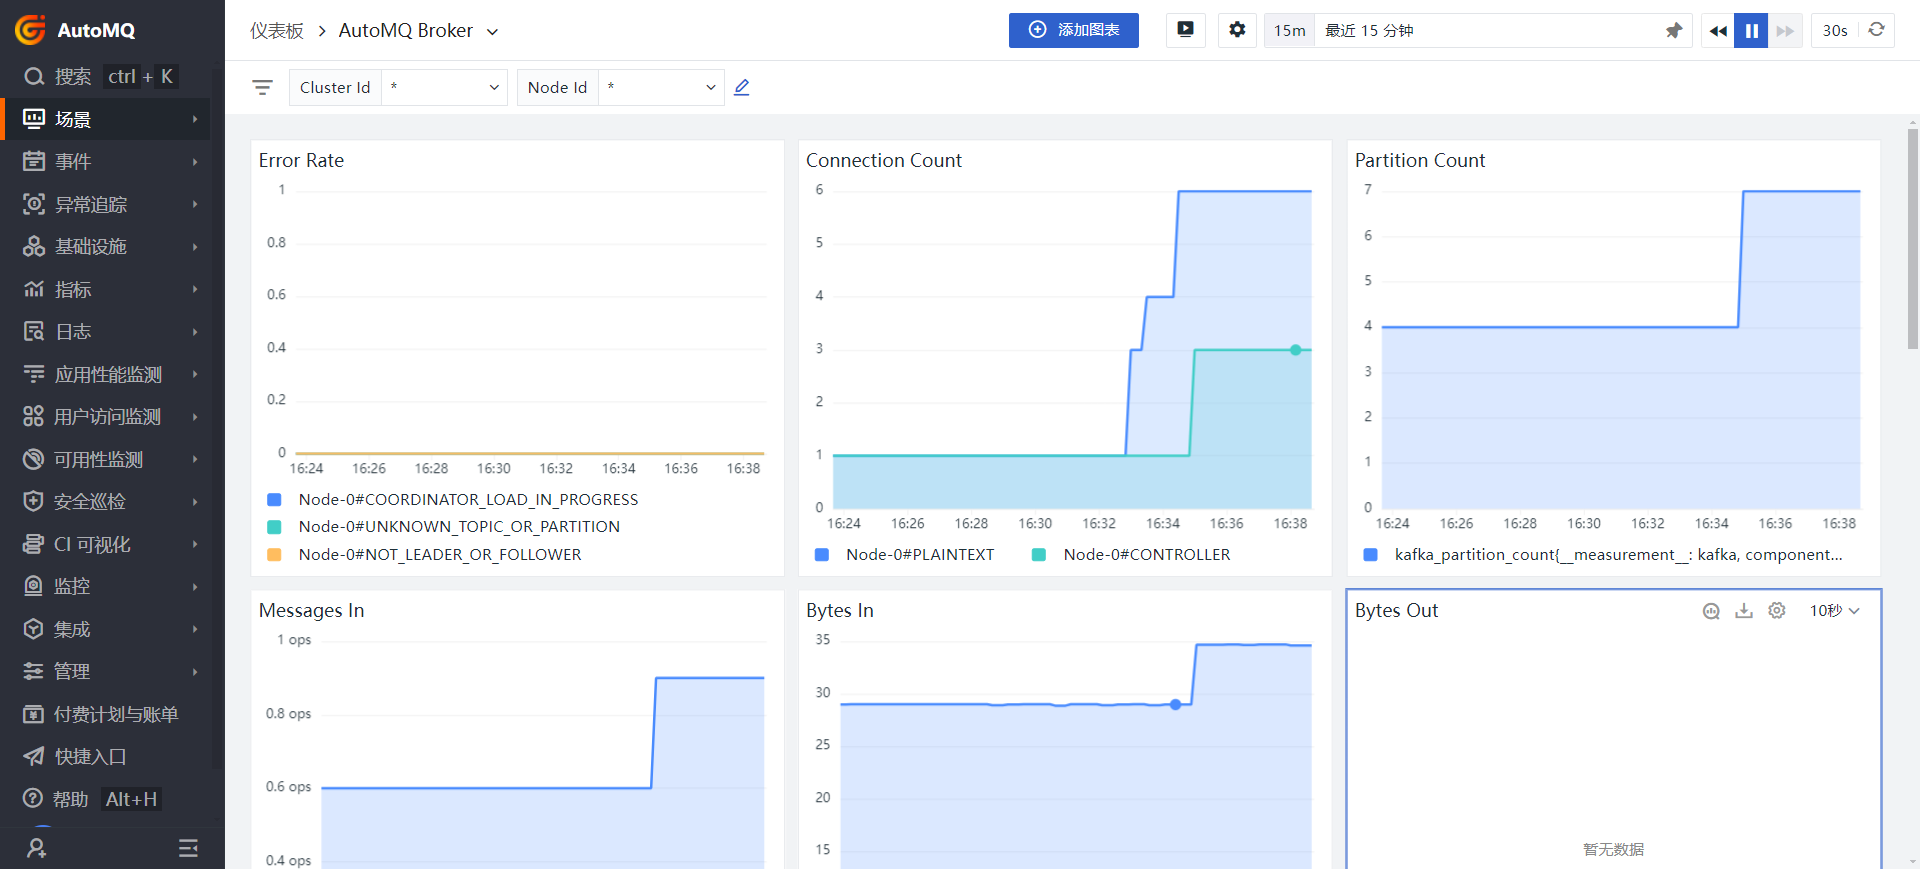
Broker Monitoring
The cloud observabilityAutoMQ Broker dashboard describes several metrics of all Brokers, such as the number of connections, partitions, the number of messages received per second (ops), and the amount of data input and output per second, measured in Bytes.
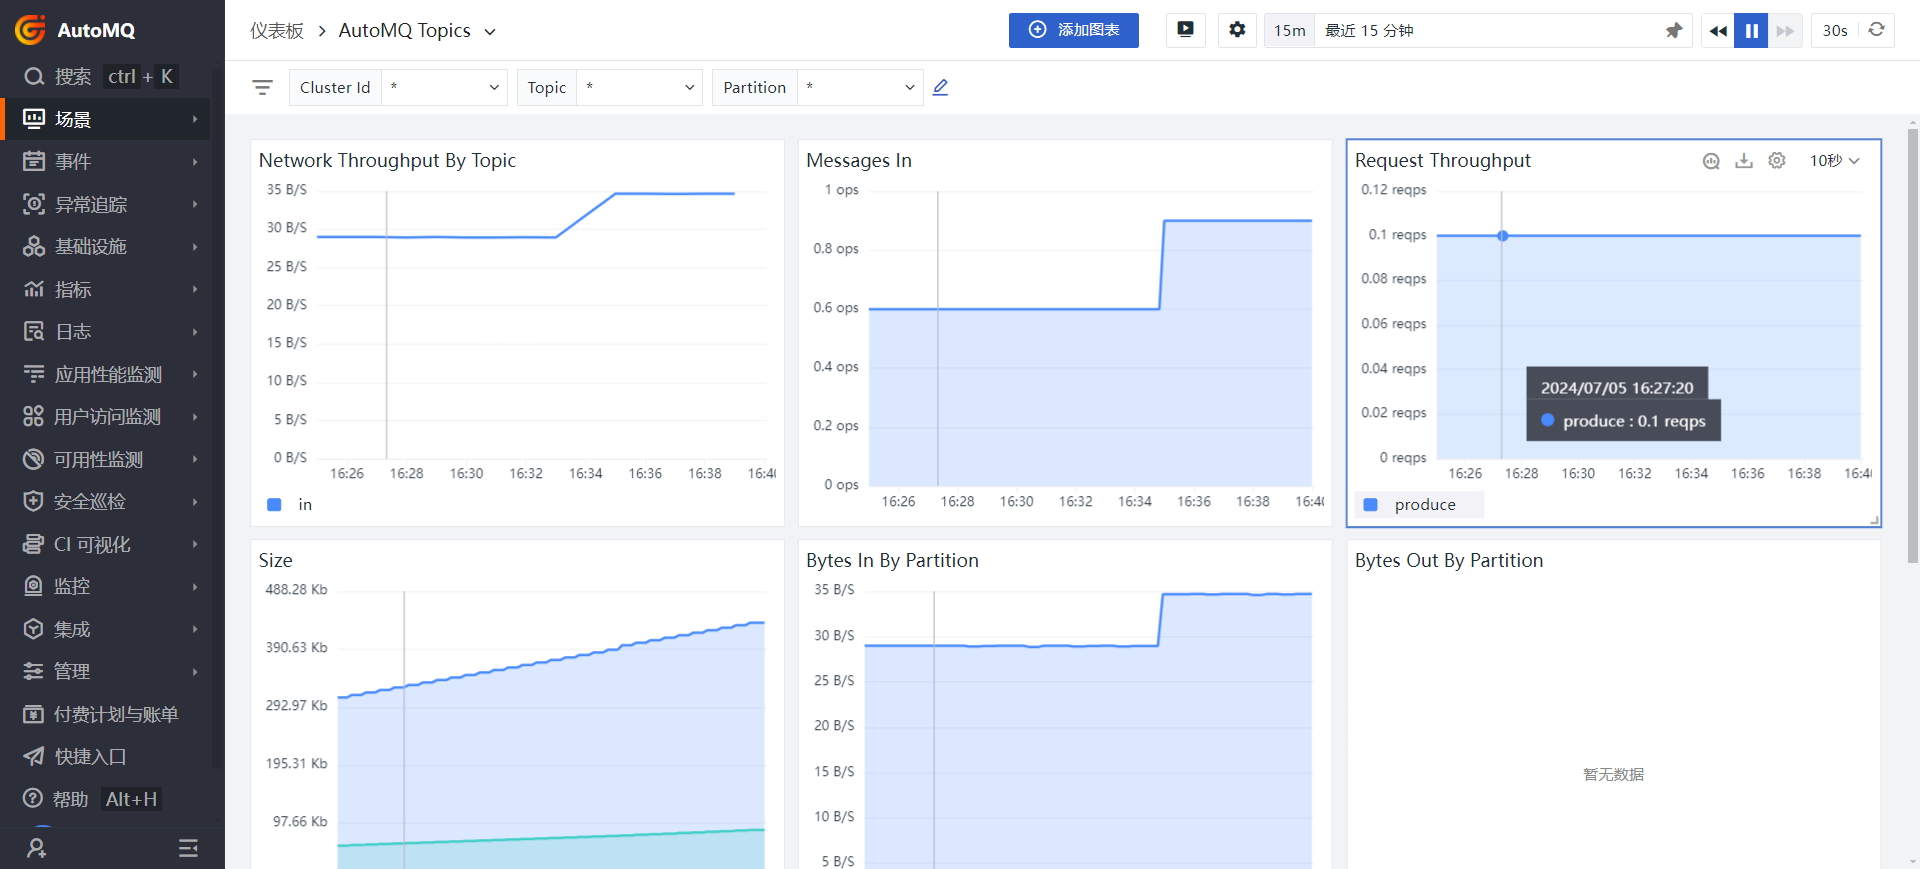
Topic Monitoring
This section provides an overview of all the Topics contained within all nodes. As previously mentioned, you can also specify a node to query the Topic information. These metrics primarily include the space occupied by each Topic, the number of messages received, and Request Throughput, which indicates the ability to process requests per unit of time.