Introduction
In modern enterprises, with the growing demand for data processing, AutoMQ as gradually become a key component for real-time data processing due to its efficiency and cost-effectiveness as a stream processing system. However, as the cluster size expands and business complexity increases, ensuring the stability, high availability, and performance optimization of the AutoMQ cluster becomes crucial. Therefore, integrating a robust and comprehensive monitoring system is essential for maintaining the healthy operation of the AutoMQ cluster. The Nightingale Monitoring System with its efficient data collection, flexible alert management, and rich visualization capabilities, is an ideal choice for enterprises to monitor AutoMQ clusters. By using the Nightingale Monitoring System, enterprises can grasp the operational status of the AutoMQ cluster in real-time, promptly identify and resolve potential issues, optimize system performance, and ensure business continuity and stability.Overview of AutoMQ
AutoMQ is a cloud-based redesigned stream processing system that maintains 100% compatibility with Apache Kafka while significantly enhancing cost efficiency and elasticity by decoupling storage to object storage. Specifically, AutoMQ offloads storage to shared cloud storage such as EBS and S3 provided by cloud vendors by building the S3Stream stream storage repository on S3, offering low-cost, low-latency, high-availability, high-reliability, and virtually unlimited capacity stream storage capabilities. Compared with the traditional Shared Nothing architecture, AutoMQ adopts a Shared Storage architecture, significantly reducing storage and operational complexity while enhancing system elasticity and reliability. The design philosophy and technical advantages of AutoMQ make it an ideal choice for replacing existing Kafka clusters in enterprises. By adopting AutoMQ, enterprises can significantly reduce storage costs, simplify operations, and achieve automatic cluster scaling and traffic self-balancing, thereby more efficiently responding to changes in business demands. Additionally, AutoMQ’s architecture supports efficient cold read operations and zero service interruption, ensuring stable system operation under high load and sudden traffic conditions. Its storage structure is as follows: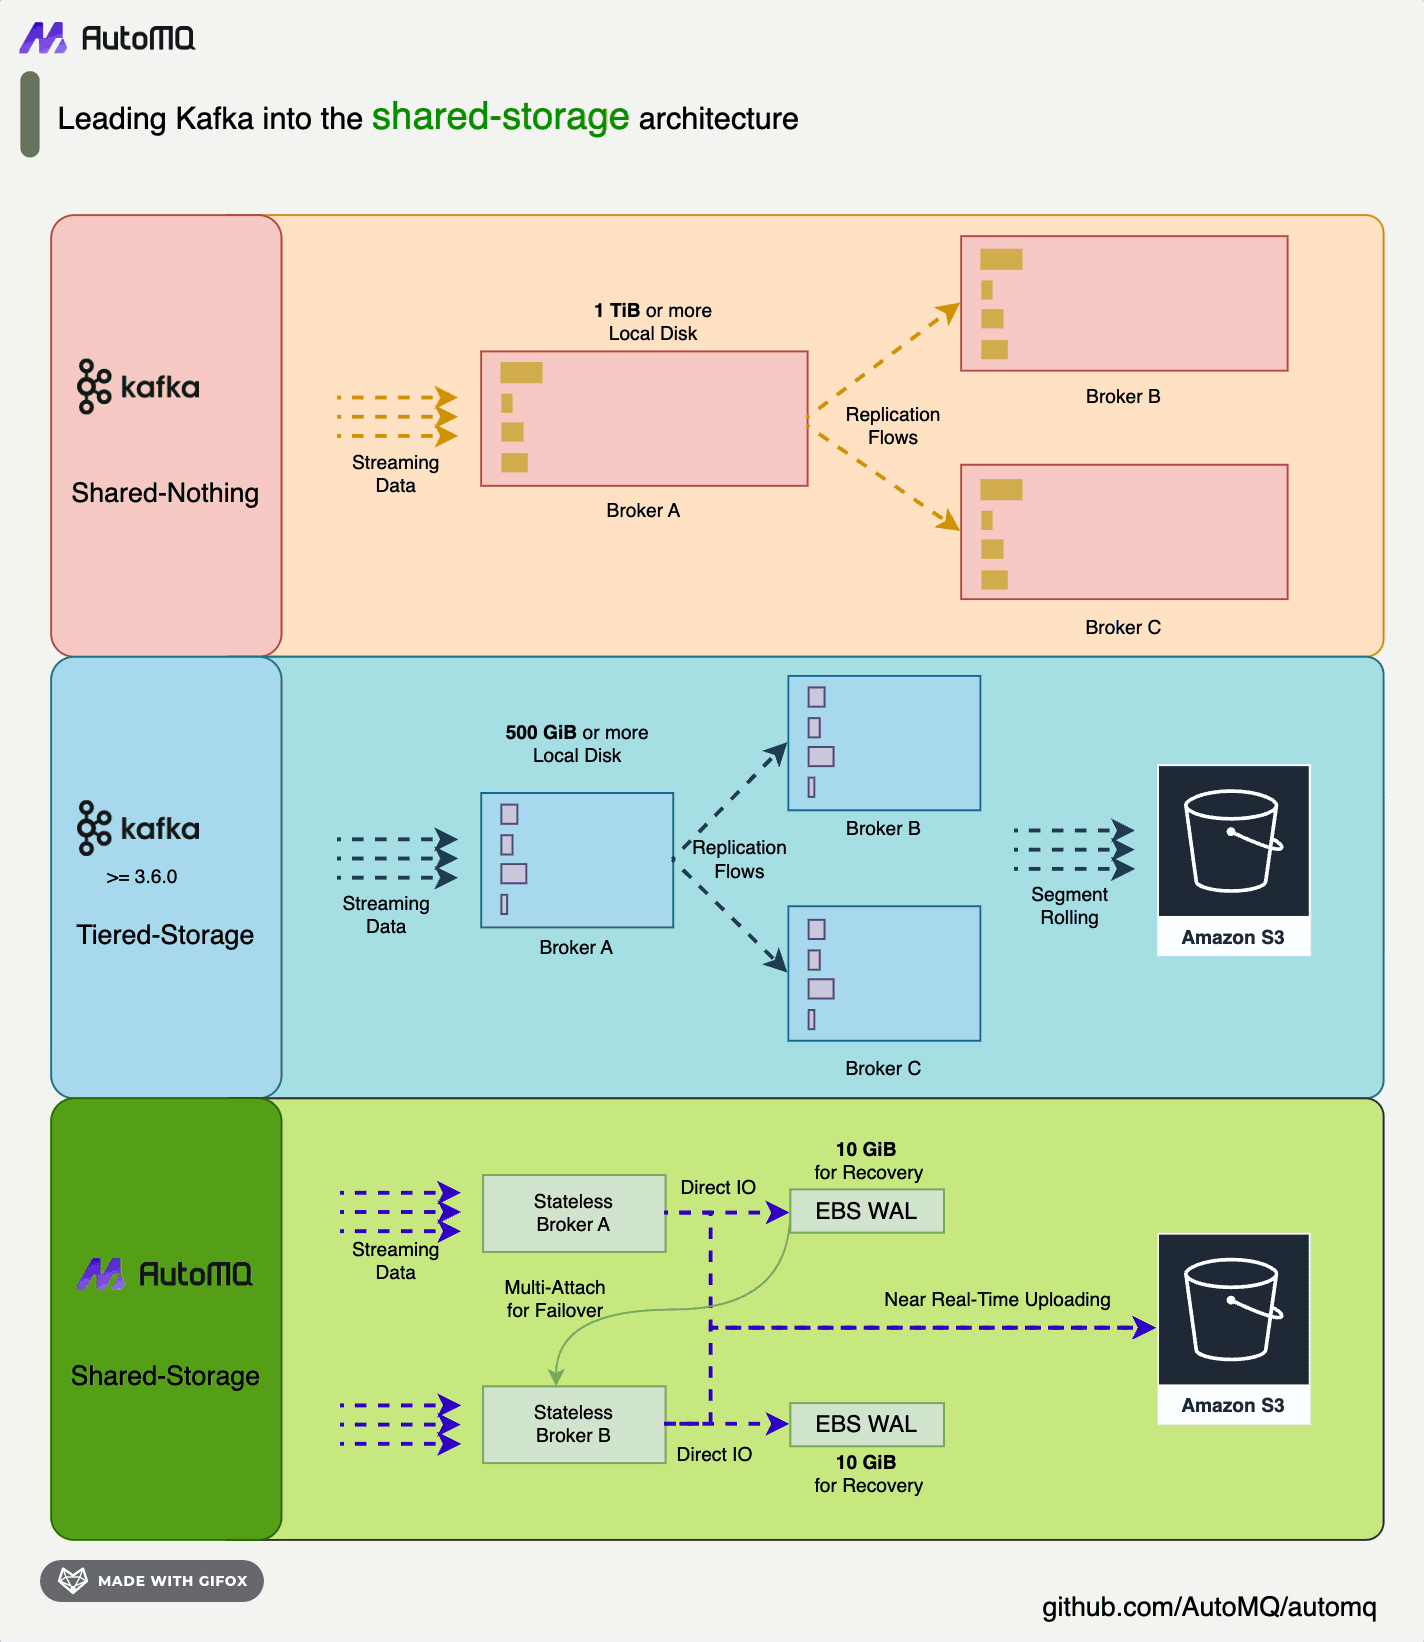
Overview of Nightingale
The Nightingale Monitoring System (Nightingale) is an open-source, cloud-native observability and analysis tool that adopts an All-in-One design philosophy, integrating data collection, visualization, monitoring alerts, and data analysis into one platform. Its main advantages include efficient data collection capabilities, flexible alert strategies, and rich visualization features. Nightingale is closely integrated with various cloud-native ecosystems, supporting multiple data sources and storage backends, and providing low-latency, high-reliability monitoring services. By using Nightingale, enterprises can achieve comprehensive monitoring and management of complex distributed systems, quickly identify and resolve issues, thereby optimizing system performance and enhancing business continuity.![Nightingale Architecture [3]](https://mintcdn.com/automq/HSGTYilF9PkMVbaa/automq/integrations/observability/flashcat/2.png?fit=max&auto=format&n=HSGTYilF9PkMVbaa&q=85&s=a046854e71a68536902bcc05351b8b7c)
Prerequisites
To monitor the status of the cluster, you will need the following setup:- Deploy an available AutoMQ node/cluster and open the Metrics collection port
- Deploy Nightingale monitoring and its dependencies
- Deploy Prometheus to collect Metrics data
Deploy AutoMQ, Prometheus, and Nightingale Monitoring
Deploy AutoMQ
Refer to the AutoMQ documentation: Deploy Multi-Nodes Cluster on Linux▸. Before deployment, add the following configuration parameters to enable the Prometheus pull interface. After starting the AutoMQ cluster with these parameters, each node will additionally open an HTTP interface to fetch AutoMQ monitoring metrics. These metrics follow the format of Prometheus Metrics.http://{node_ip}:8890. An example of the response results is as follows:
Deploying Prometheus
Prometheus can be deployed by downloading the binary package or using Docker. Below is an introduction to these two deployment methods.Binary Deployment
For ease of use, you can create a new script and modify the Prometheus download version as needed. Then, execute the script to complete the deployment. First, create a new script:client_ip to the AutoMQ observable data exposure address:
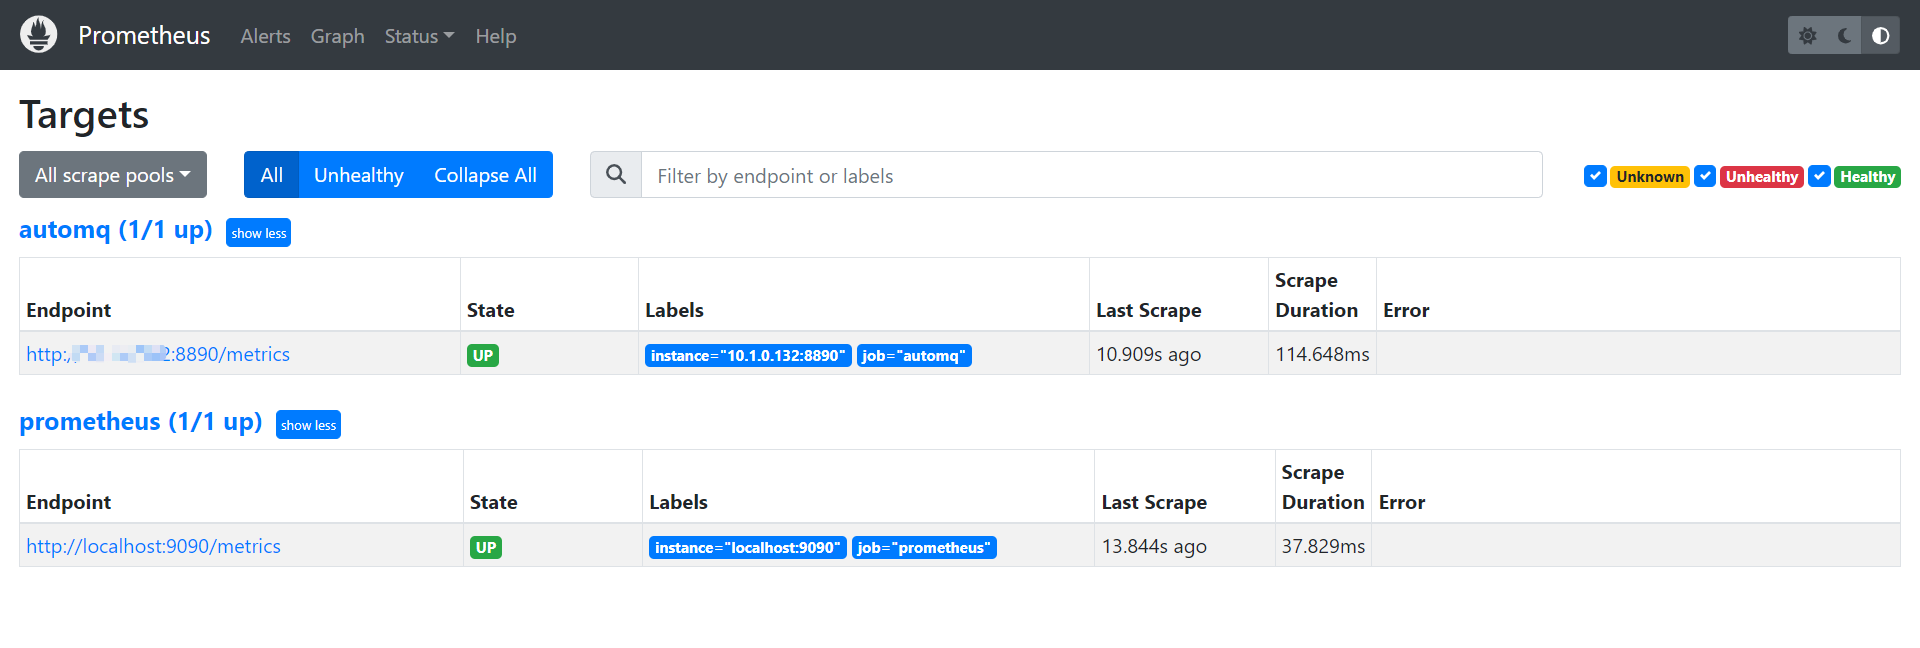
http://{client_ip}:9090/targets:
Docker Deployment
If you already have a running Prometheus Docker container, please execute the following command to remove the container:Deploy Nightingale Monitoring
Nightingale monitoring can be deployed in the following three ways. For more detailed deployment instructions, please refer to the official documentation [5]:- Deploy using Docker compose
- Deploy using binary
- Helm Deployment
Download Nightingale
Please select the appropriate version to download from the Nightingale GitHub releases [6] page. The version used here isv7.0.0-beta.14. If you are on an amd architecture machine, you can directly execute the following command:
Configure the Dependency Environment
Nightingale depends on MySQL and Redis, so you need to install these environments beforehand. You can deploy them via Docker or by executing the commands as follows:1234. If you need to change to another password, you need to configure it in the Nightingale configuration file to ensure Nightingale can connect to your database. Modify the Nightingale configuration file:
Import Database Tables
Execute the following command:Modify the Nightingale Configuration File
You need to modify the Nightingale configuration file to set up the Prometheus data source:Start Nightingale
In the root directory of Nightingale/home/flashcat, execute: ./n9e. After a successful start, you can access it in your browser at http://{client_ip}:17000, with the default login username and password being:
- Username:
rootyaml - Password:
root.2020bash
Integrate Prometheus Data Source
Left sidebar Integration -> Data Source -> Prometheus.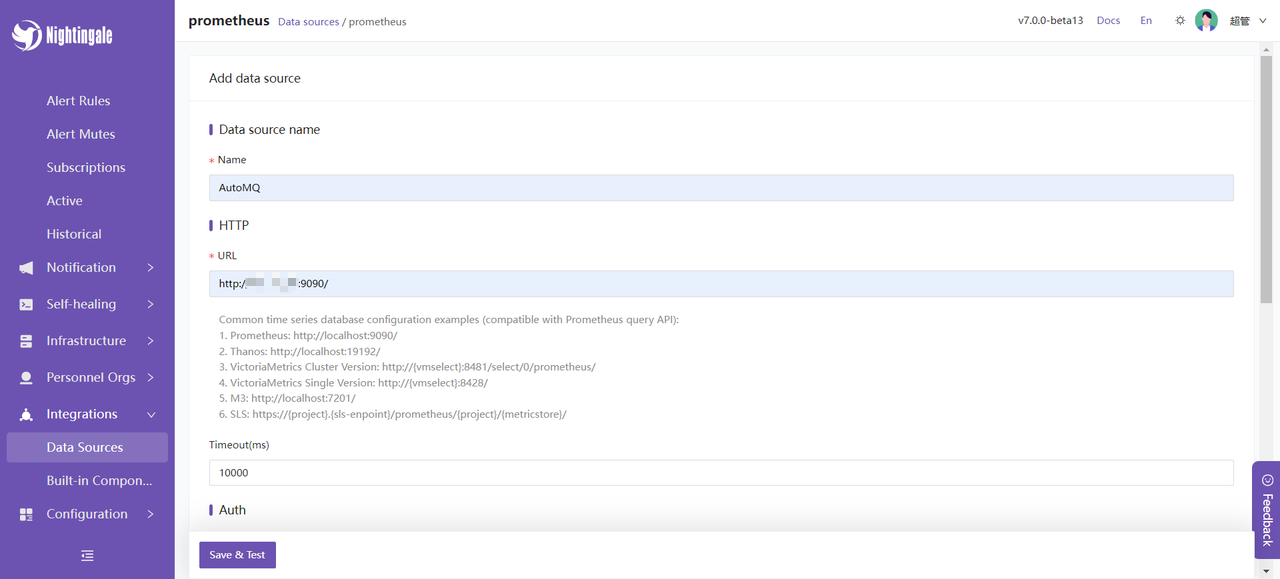
Nightingale Monitoring AutoMQ Cluster Status
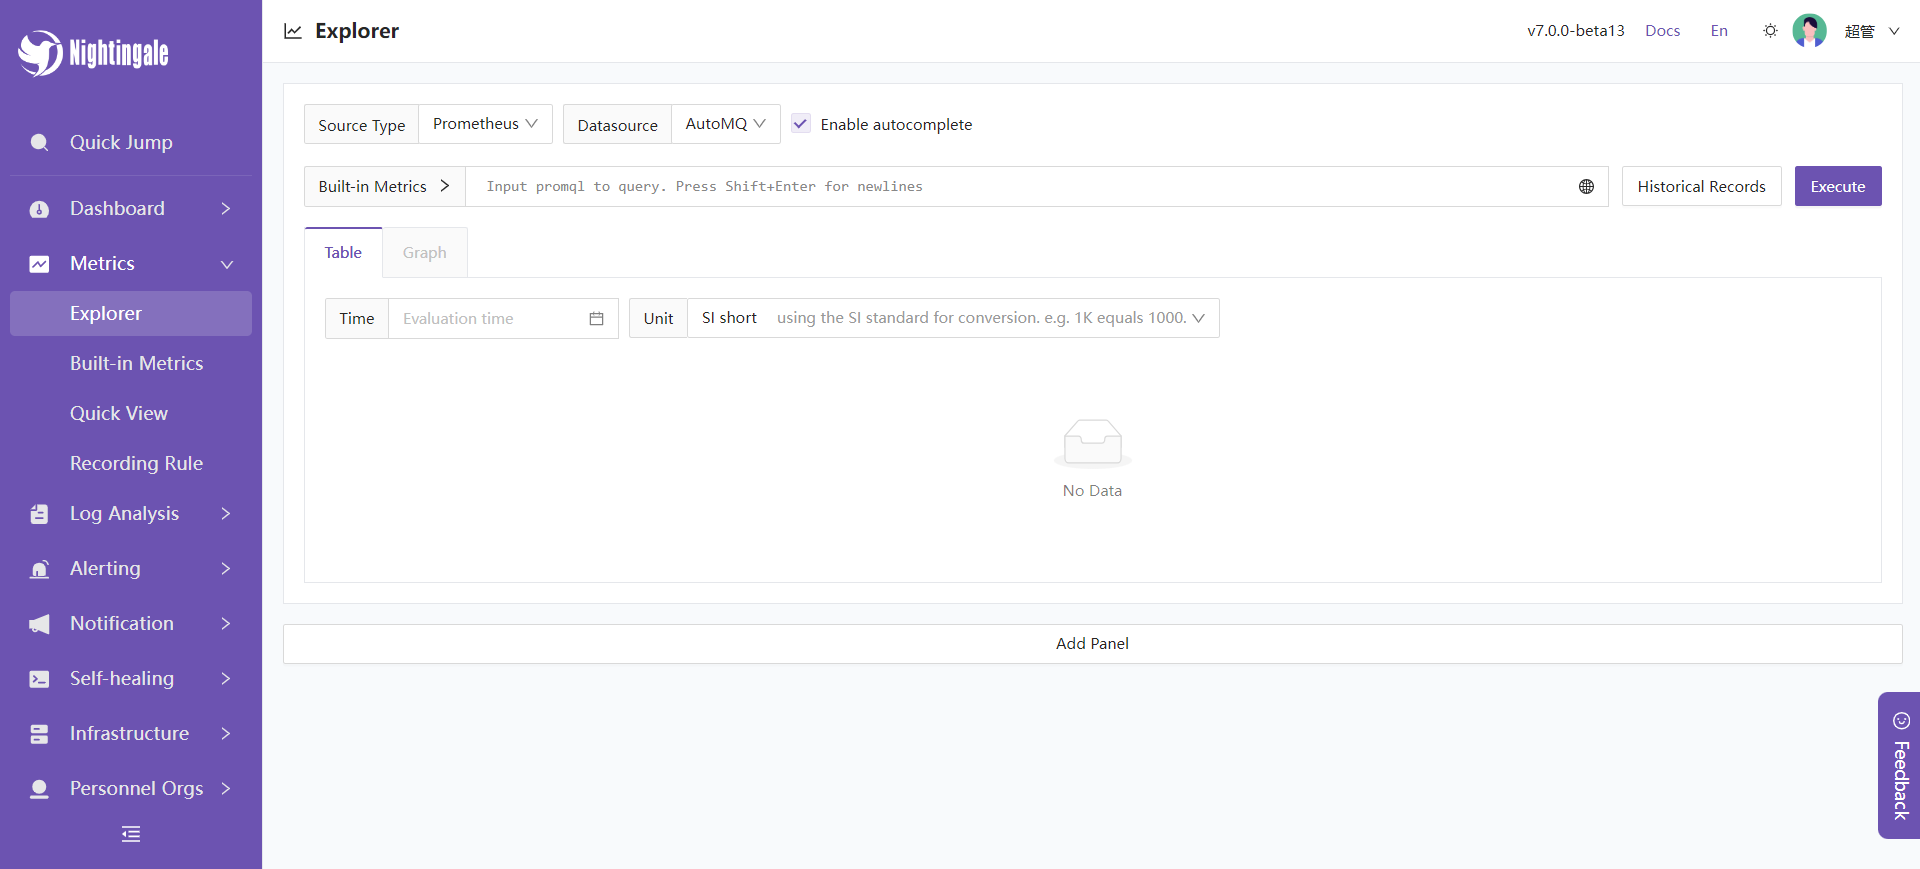
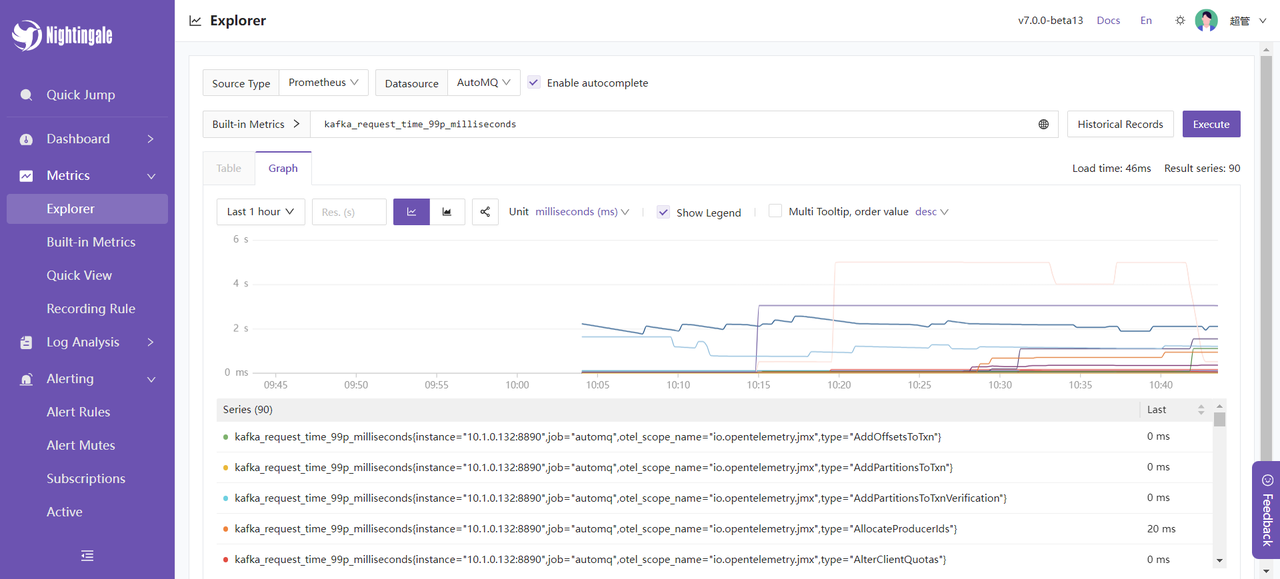
Next, we will introduce some of the features provided by Nightingale monitoring to help you better understand the available features integrated with AutoMQ.Instant Query
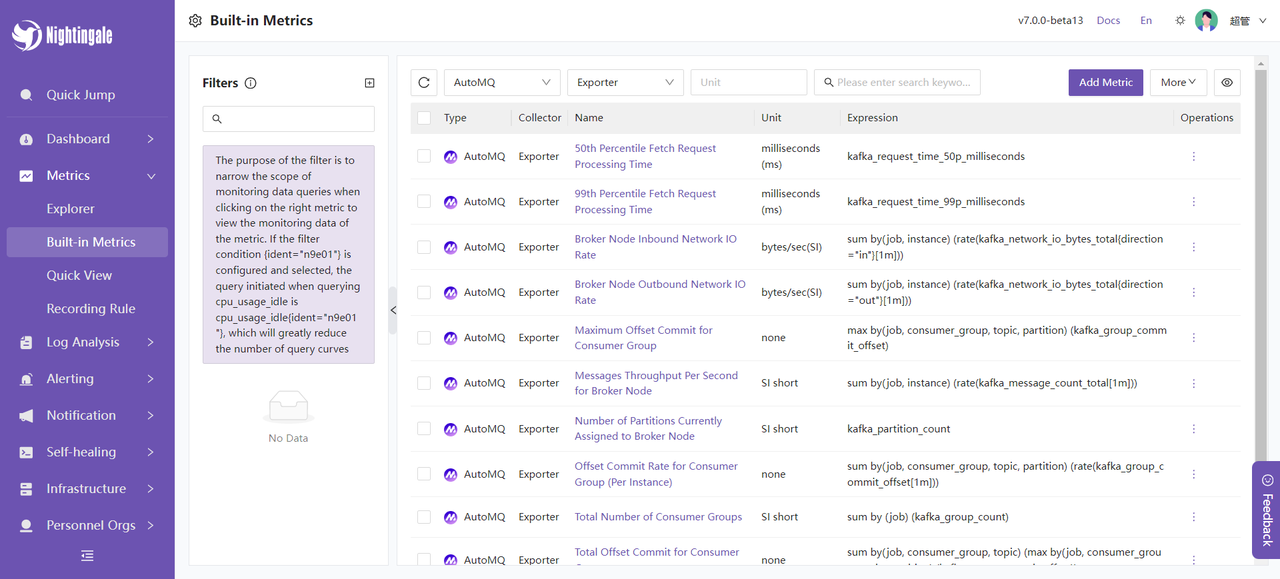
Select built-in AutoMQ metrics: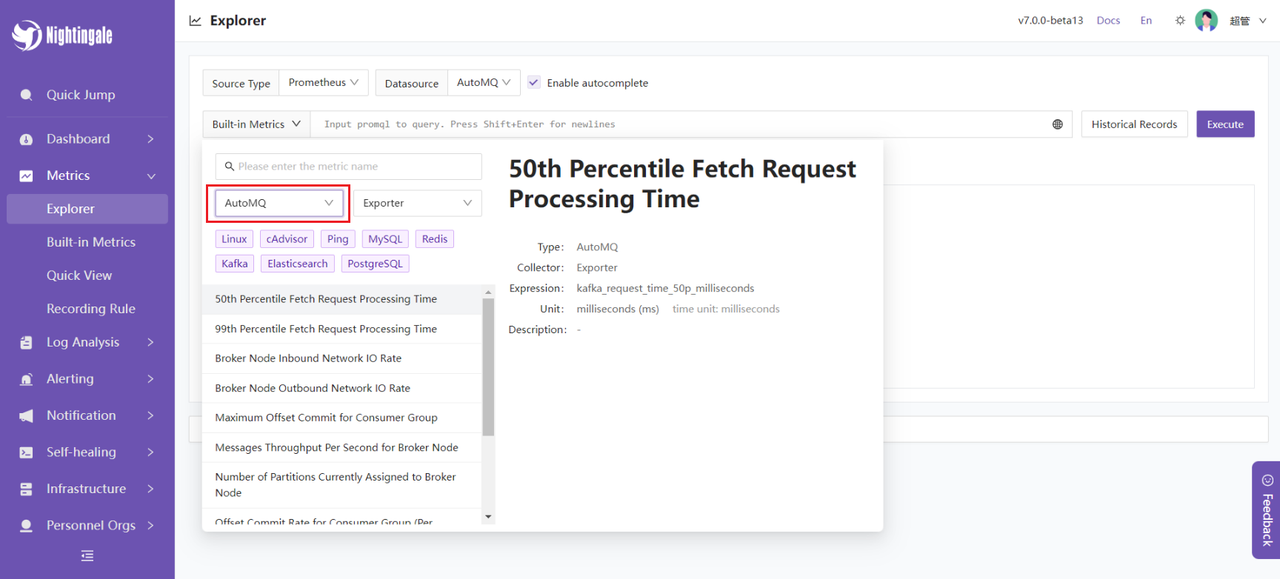
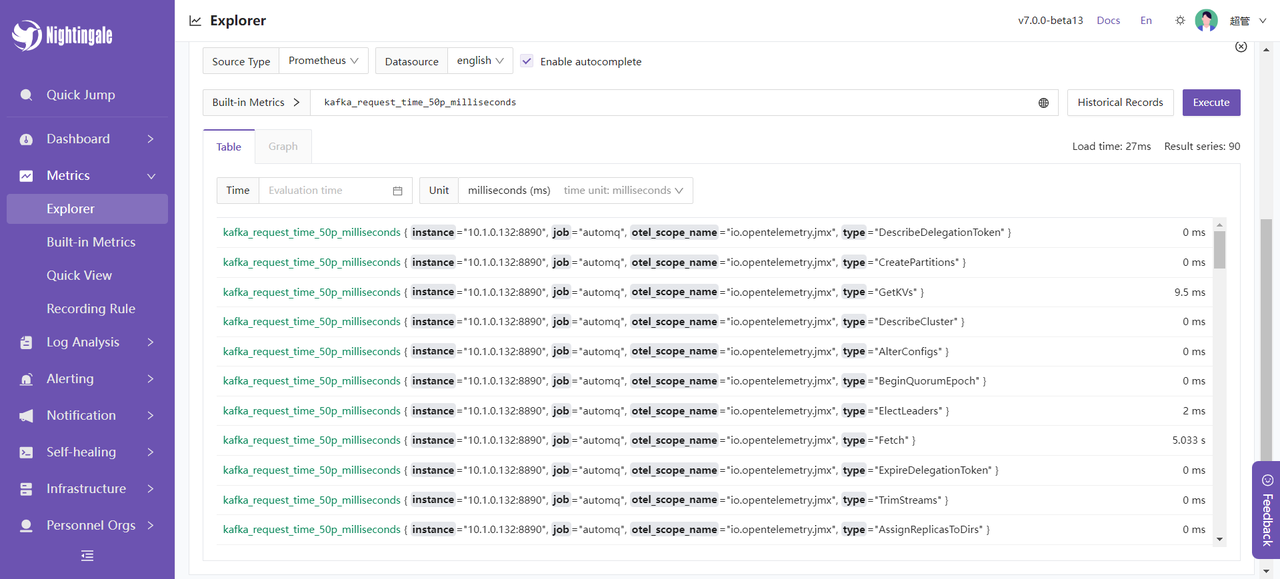
kafka_request_time_50p_milliseconds:
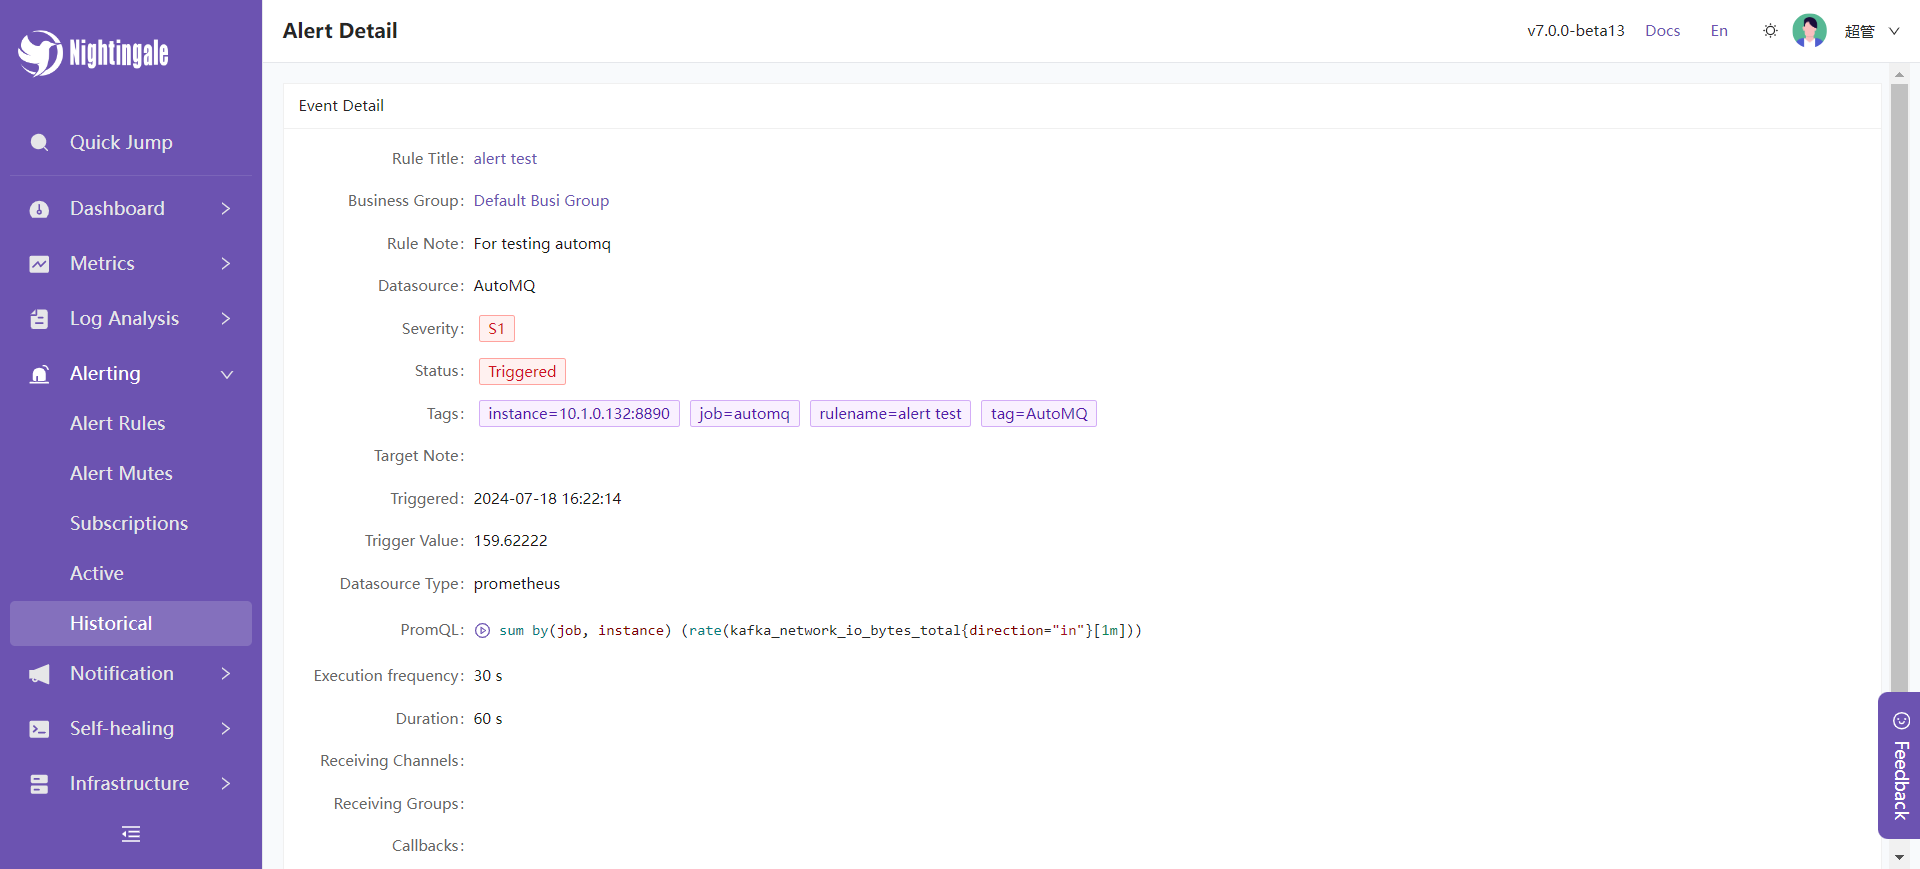
Alerting Feature
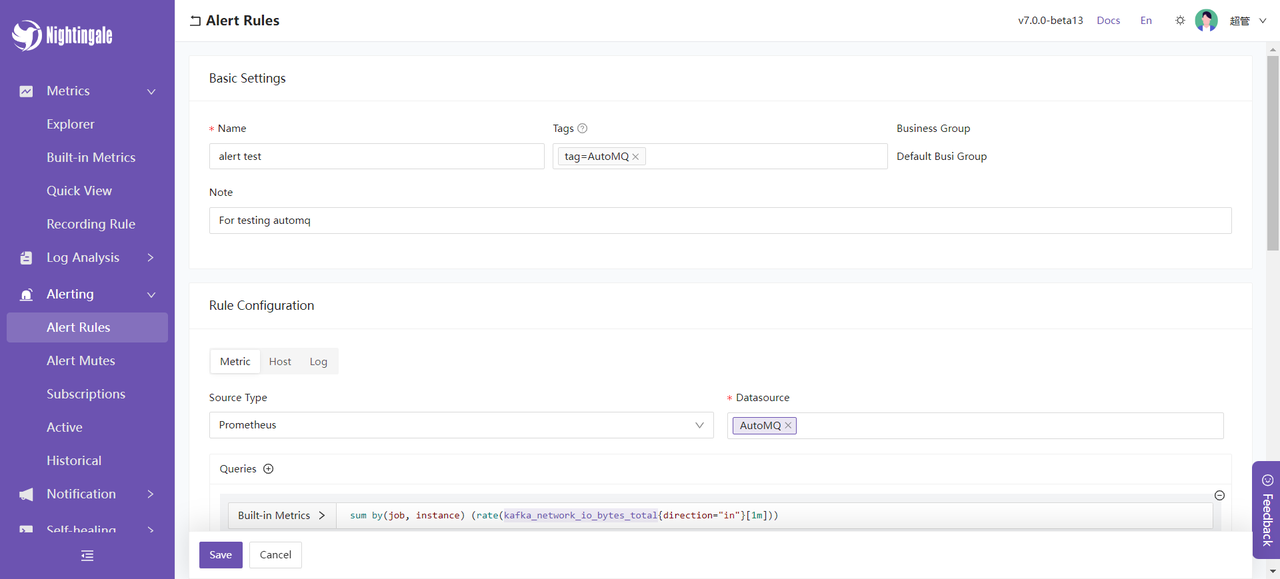
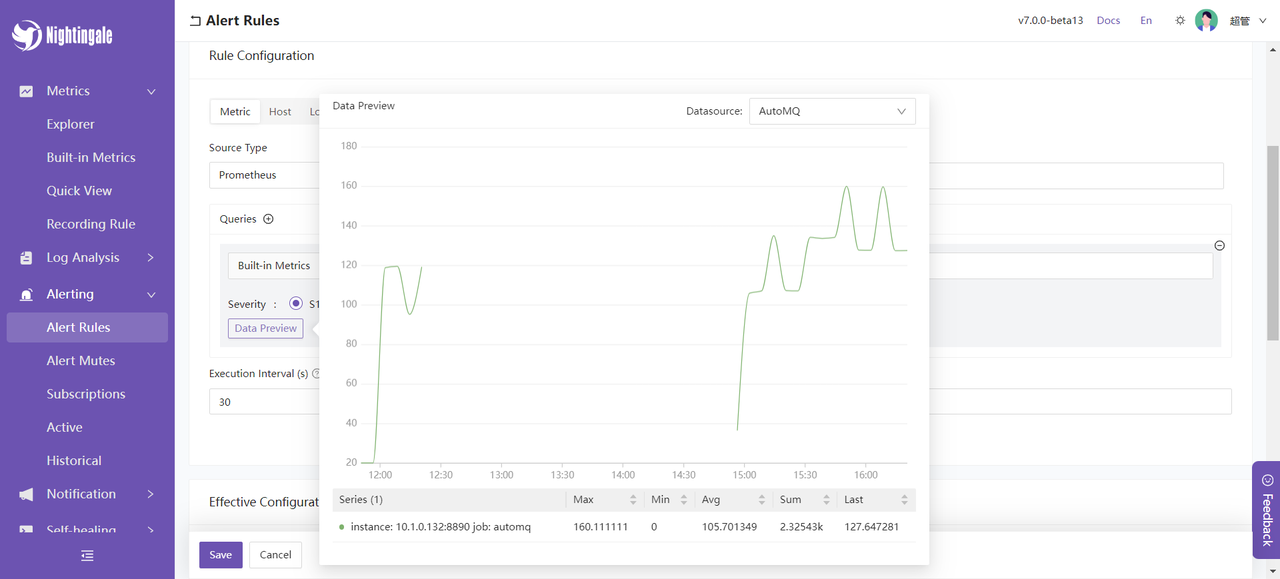
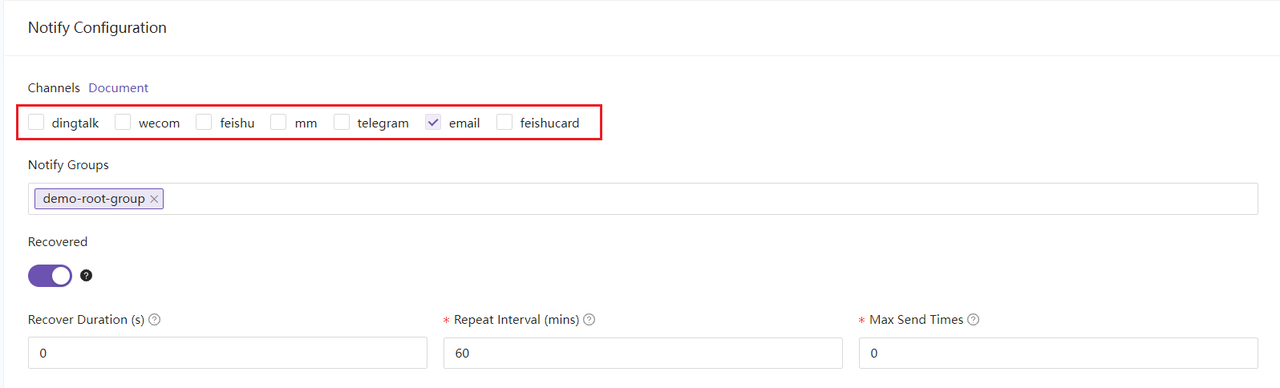
Select from the left sidebar Alerts -> Alert Rules -> Create New Rule. For example, you can set an alert forkafka_network_io_bytes_total, which measures the total number of bytes sent or received by Kafka Broker nodes over the network. By setting an expression for this metric, you can calculate the inbound network I/O rate for Kafka Broker nodes. The expression is:
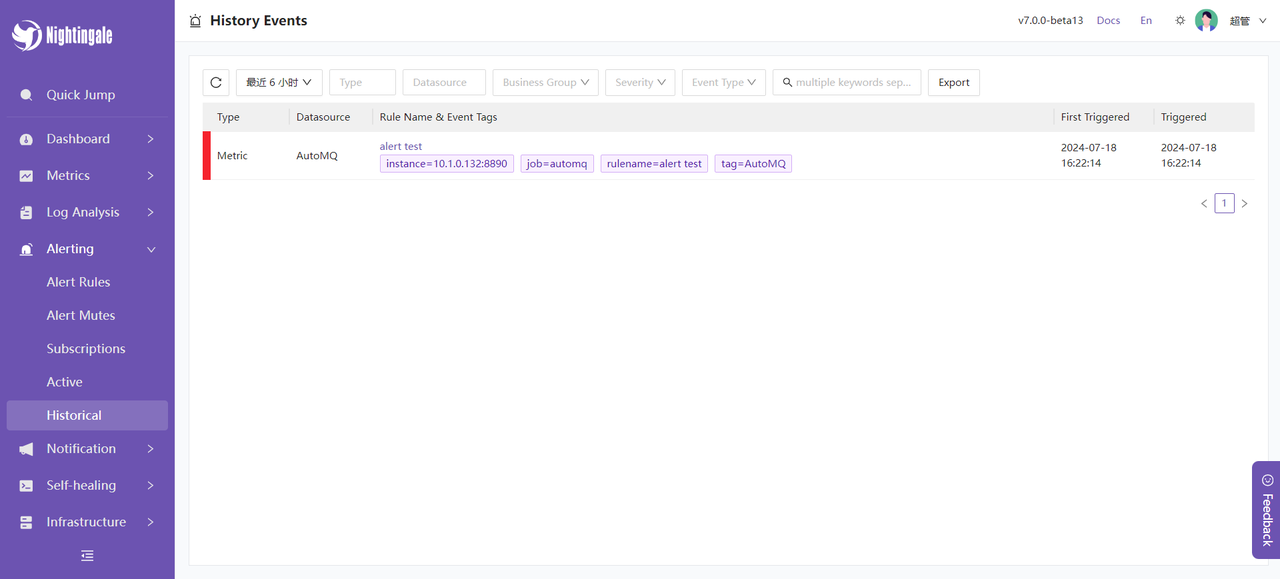
2500000 messages are sent to AutoMQ nodes within a short period. The method used is sending messages through the Kafka SDK, with a total of 50 Topics, each Topic receiving 500 messages, repeated 100 times. An example is as follows:
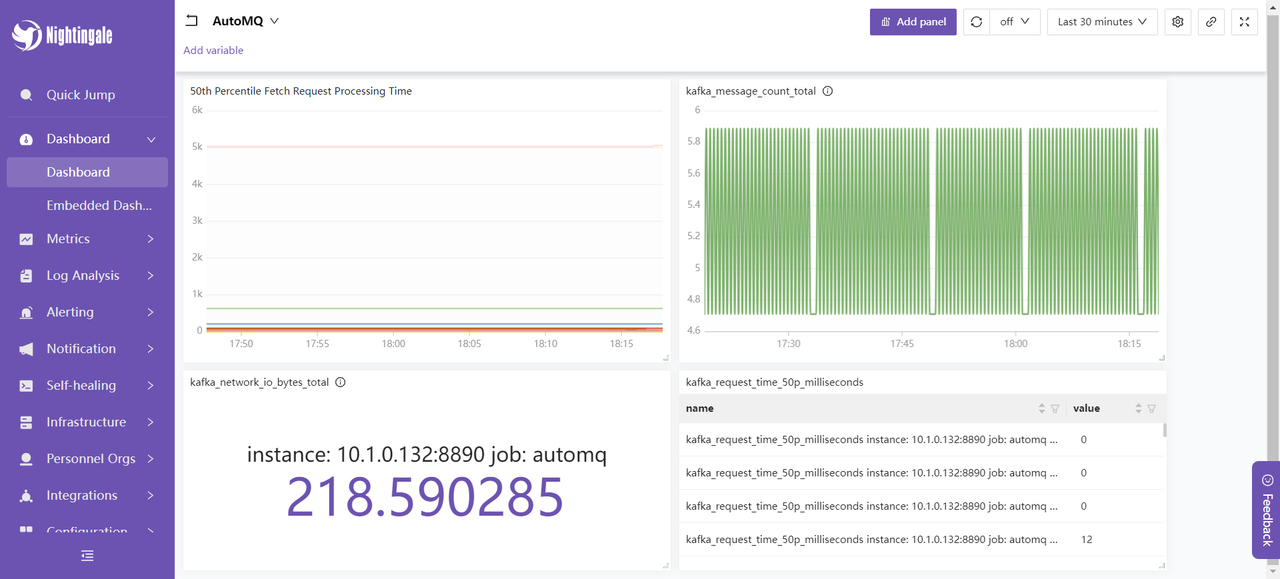
Dashboard
First, you can use the known metrics to create your own dashboard. Below is an example of a statistical dashboard for AutoMQ message request processing time, total message count, and network IO bits: