Manage Kafka/AutoMQ Clusters More Conveniently Using the Kafka Web UI.
With the rapid advancement of big data technologies, Kafka has become a cornerstone for real-time data processing in enterprises as a high-throughput, low-latency distributed messaging system. However, managing and monitoring Kafka clusters is not an easy task. Traditional command-line tools and scripts, while powerful, can be complex and unintuitive for developers and operations personnel. To address these challenges, the Kafka Web UI has emerged, providing users with a more convenient and efficient way to manage Kafka clusters. After over a decade of development, Apache Kafka has amassed a wealth of ecosystem resources within the industry. AutoMQ, as a successor to Apache Kafka, can leverage products within its ecosystem due to its full compatibility with Kafka. The enterprise edition of AutoMQ already offers substantial control capabilities. If you are using AutoMQ, you can also utilize products like Kafdrop, Redpanda Console [1], and similar tools to manage AutoMQ clusters. Today’s content covers how to monitor the status of AutoMQ clusters using Redpanda Console [1] to enhance system maintainability and stability.Integration of AutoMQ with Redpanda Console
Redpanda Console is a Kafka Web UI provided by Redpanda, designed for monitoring and managing Redpanda or Kafka clusters. It offers an intuitive user interface through which users can easily view cluster status, monitor performance metrics, and manage topics and partitions. This console is aimed at simplifying the day-to-day operations of data streaming systems, enabling users to maintain and monitor their clusters more effectively. Thanks to AutoMQ being fully compatible with Kafka, it seamlessly integrates with Redpanda Console. By leveraging Redpanda Console, AutoMQ users can also benefit from an intuitive user interface to monitor the real-time status of AutoMQ clusters, including vital metadata such as topics, partitions, consumer groups, and their offsets. This monitoring capability not only enhances the efficiency of problem diagnosis but also helps optimize cluster performance and resource usage. This tutorial will guide you on how to launch the Redpanda Console service and use it alongside AutoMQ clusters to effectively monitor and manage cluster status.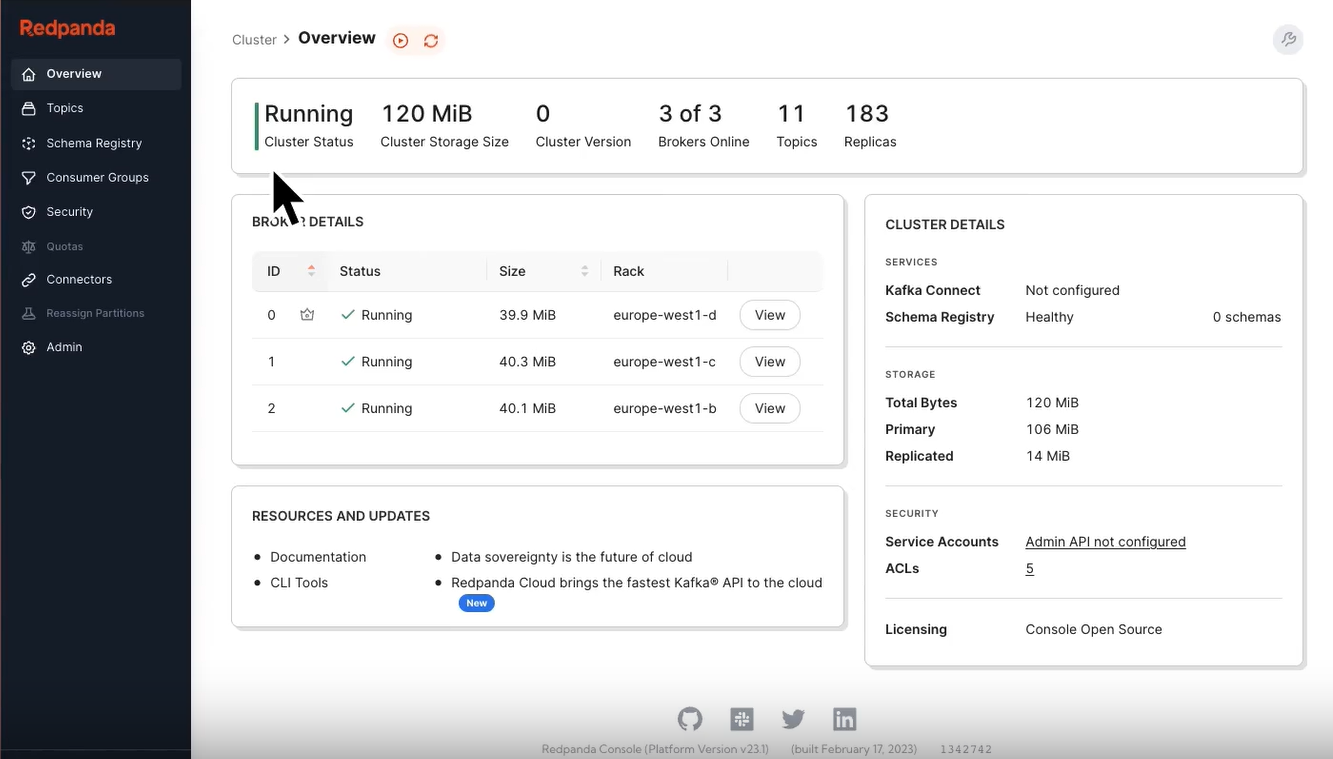
Prerequisites
- Deploy AutoMQ Cluster
- Prepare Redpanda Console Environment
Deploy AutoMQ Cluster
Please refer to the official AutoMQ documentation: Deploy Multi-Nodes Cluster on Linux▸ [3].Deploy Redpanda Console
There are two ways to deploy the Redpanda Console: Docker deployment and distribution deployment. Docker deployment is simpler, and if you want a quick and easy experience integrating AutoMQ with the Redpanda Console, it is recommended to choose Docker for deployment. If you have specific requirements, such as login authentication, SASL authentication, TLS configuration, and log level settings, you should opt for distribution deployment. Below, I’ll introduce the configuration methods for both.Docker Deployment
Redpanda Console can be deployed via Docker, referring to Quick Start [4]. In the process described above, after setting up the AutoMQ cluster, you will know the addresses and ports that all Broker nodes listen to. Thus, you can establish an association between the Redpanda Console and the AutoMQ cluster by specifying theKAFKA_BROKERS parameter in the Docker startup command. The Docker container startup command is as follows:
-
-p 8080:8080: Specifies the service access mapping port for the Redpanda Console. -
KAFKA_BROKERS: Must be specified as the Broker address of your AutoMQ cluster.
Deployment of Distribution
You need to choose an appropriate version to download and extract it into a specified directory, such as/opt, from Redpanda Console’s GitHub Releases page: Release Redpanda Console [5]. The command is as follows:
redpanda-console-config.yaml configuration file is shown below:
Note: Please ensure that the server where you are installing Redpanda Console has access to the server where the Broker node mentioned in the configuration file is located.For more detailed settings, refer to the official documentation: Redpanda Console Configuration [6]. After completing the configuration, you need to set environment variables so that the Redpanda Console executable can access the configuration file information and start the Redpanda Console:
Access the Console Page
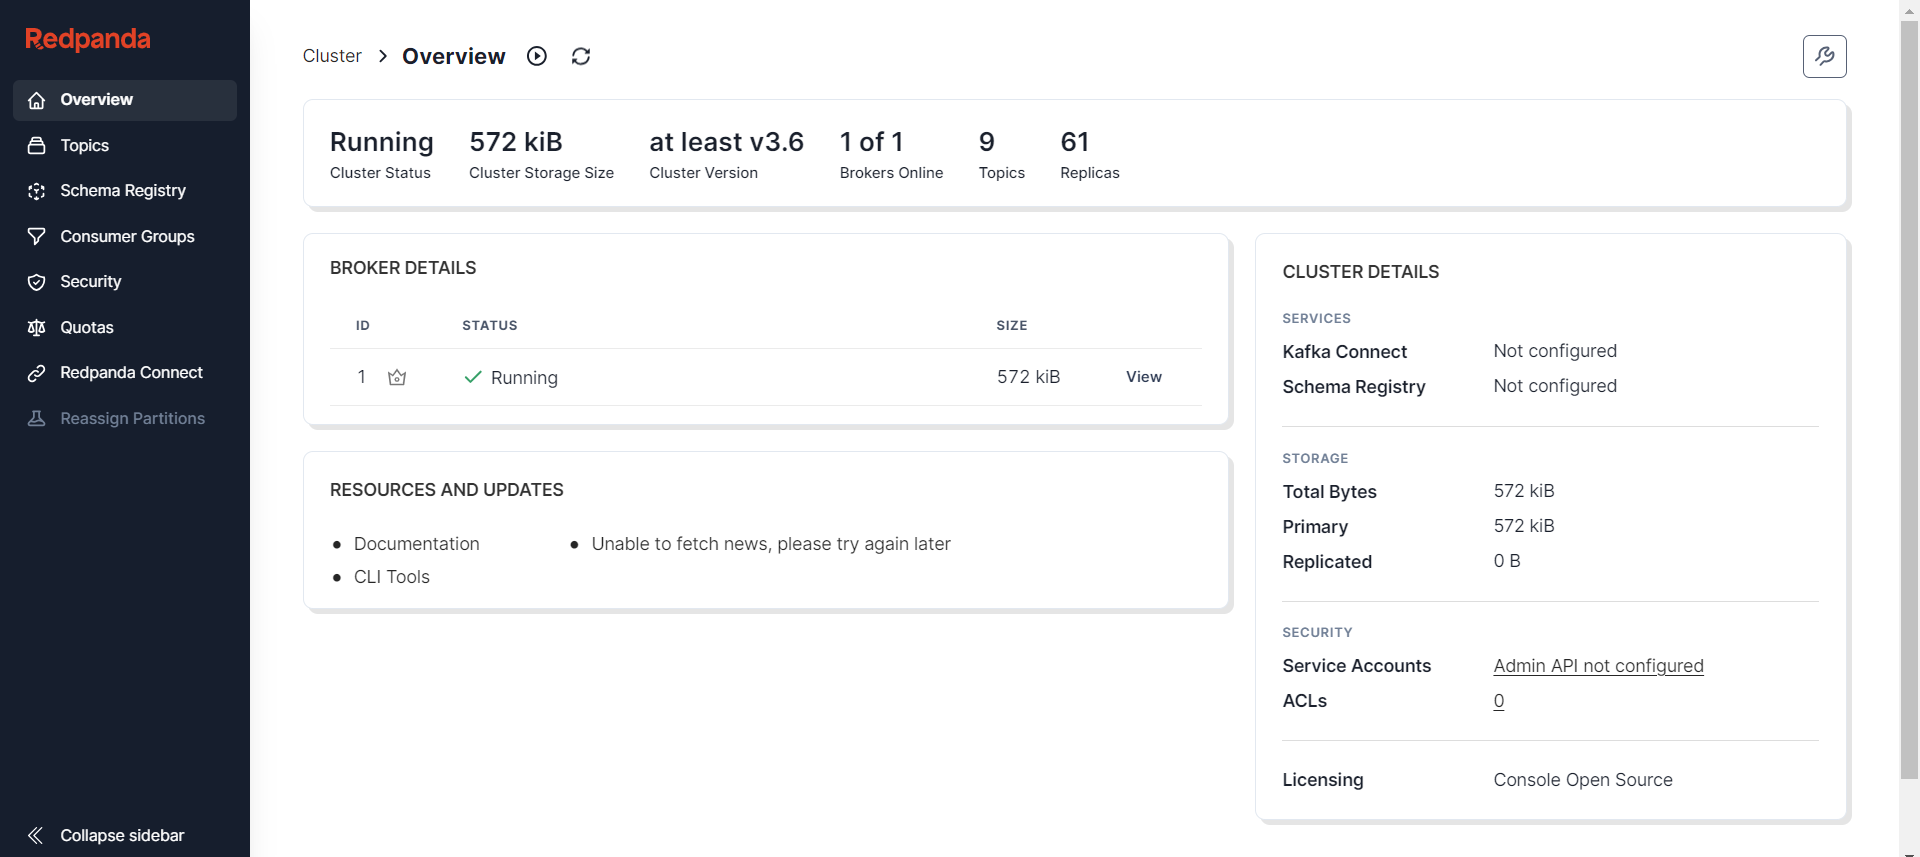
After completing the above deployment operations, you can access the console service by entering the address in your browser (e.g., http://console_ip:8080). The display will appear as follows:Cluster Overview
The Cluster Overview page provides users with a broad perspective, displaying the core information of the AutoMQ cluster, including but not limited to:- Cluster Operational Status: Displays the current health of the cluster, helping users quickly identify any issues.
- Storage Utilization: Indicates data storage usage within the cluster, aiding users in managing and planning storage effectively.
- Version Information: Shows the version of the running AutoMQ cluster, simplifying the tracking and upgrading process.
- Number of Online Brokers: Displays the real-time count of online brokers, an essential metric.
- Number of Topics and Replicas: Provides information on the number of topics and replicas, assisting users in understanding the cluster’s scale and data replication status.
Topic Overview
On the Topic list page, users can see an overview of all Topics in the current AutoMQ cluster, including essential details for each Topic, such as the number of partitions and replica strategy. This page allows users to efficiently browse and manage Topics.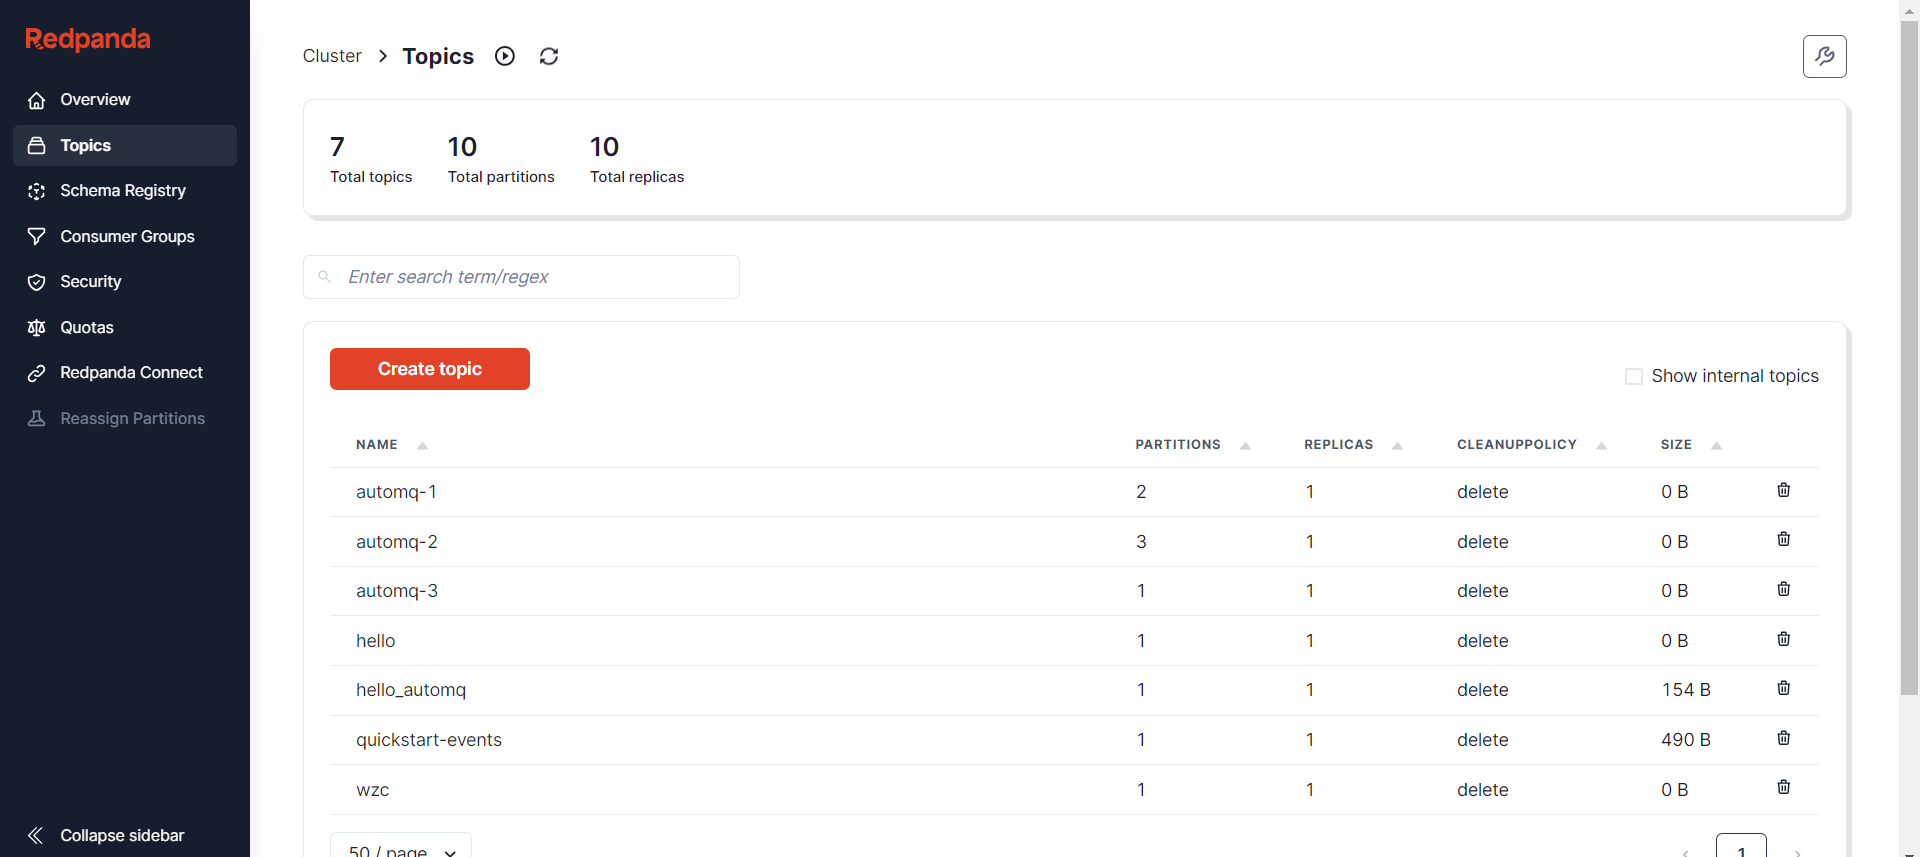
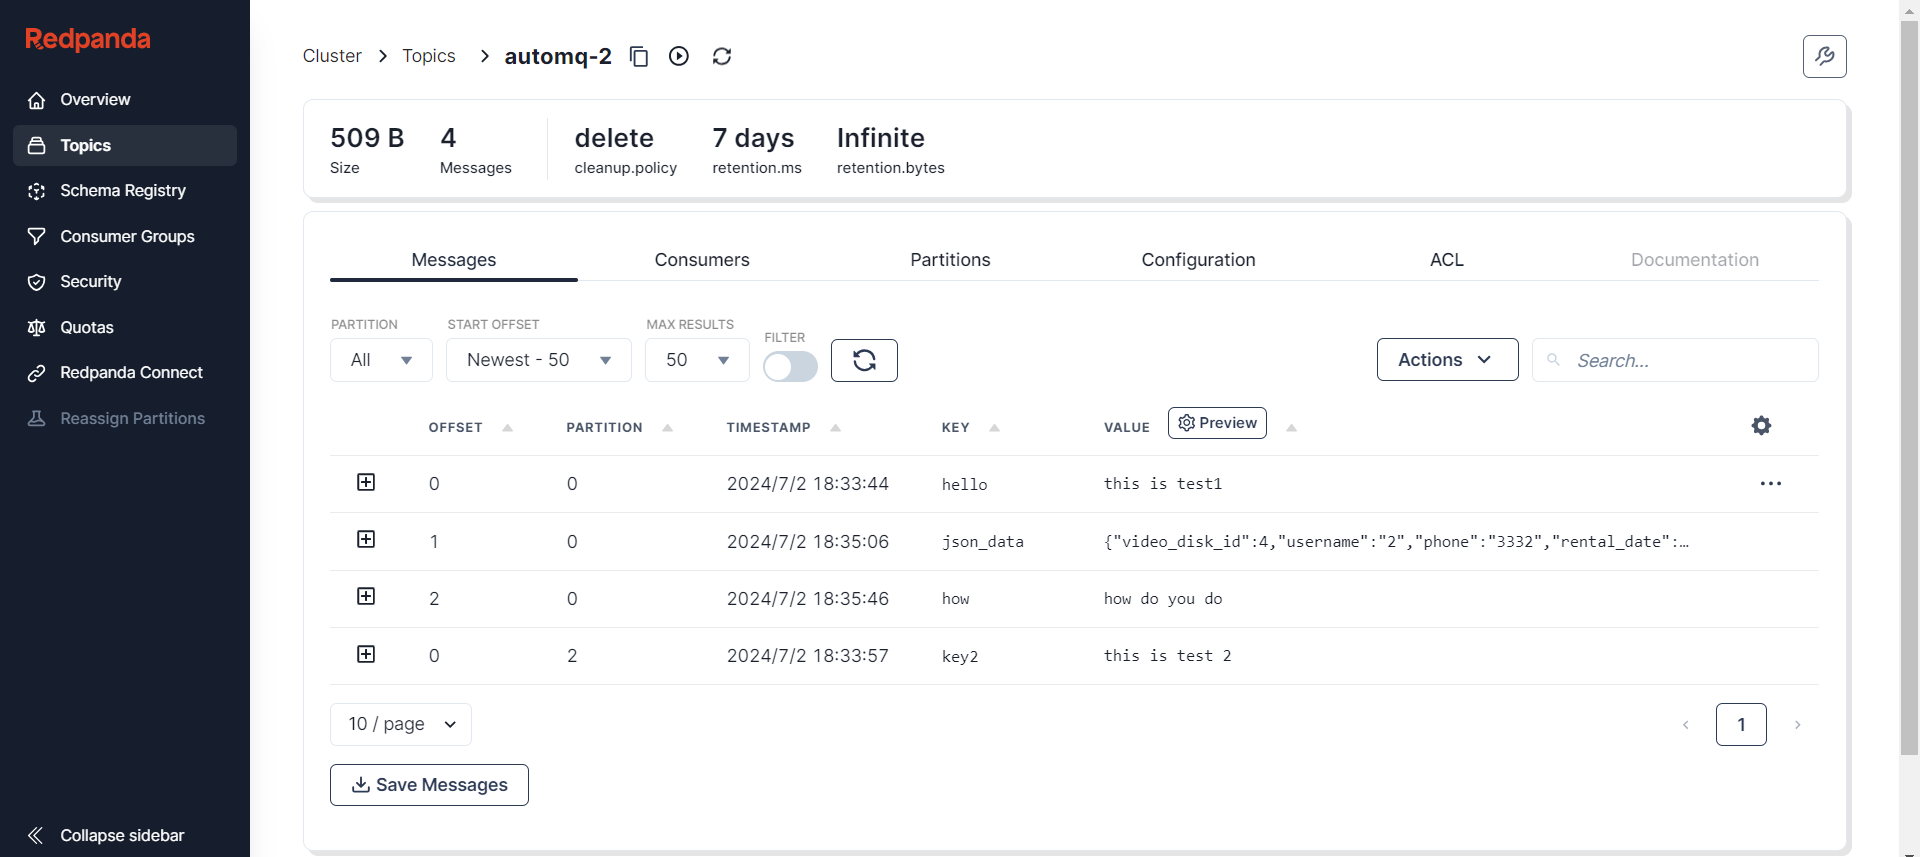
Topic Details
By clicking on a specific Topic, users navigate to a detailed page for that Topic, where they can further explore understanding and operational functionalities:- Message List: Browsing and searching messages within a Topic is highly beneficial for tracking and debugging purposes.
- Consumer Information: Displays information on consumers and consumer groups currently subscribed to the Topic, facilitating the monitoring of consumption status.
- Partition Status: Provides detailed information for each partition, including key metrics like Leader and ISR.
- Configuration Information: Lists the configuration settings of the Topic, with support for modifications to optimize performance or behavior.
- ACL (Access Control List): Manages access permissions for the Topic to ensure data security.