
Introduction
In modern enterprises, with the continuous growth in data processing demands, AutoMQ [1], an efficient and cost-effective stream processing system, has gradually become a crucial component for real-time data processing. However, with the expansion of cluster scale and increasing business complexity, ensuring the stability, high availability, and performance optimization of the AutoMQ cluster becomes particularly critical. Therefore, integrating a robust and comprehensive monitoring system is essential for maintaining the healthy operation of the AutoMQ cluster. [Prometheus][2], with its powerful data collection and querying capabilities, is an ideal choice for enterprises to monitor AutoMQ clusters. To address the limitations of Prometheus in large-scale data storage, [VictoriaMetrics][3], an efficient time-series database storage backend, can provide stronger storage and querying performance. By integrating Prometheus and VictoriaMetrics, enterprises can achieve comprehensive monitoring of AutoMQ clusters, ensuring system high availability and performance optimization.
Overview of AutoMQ
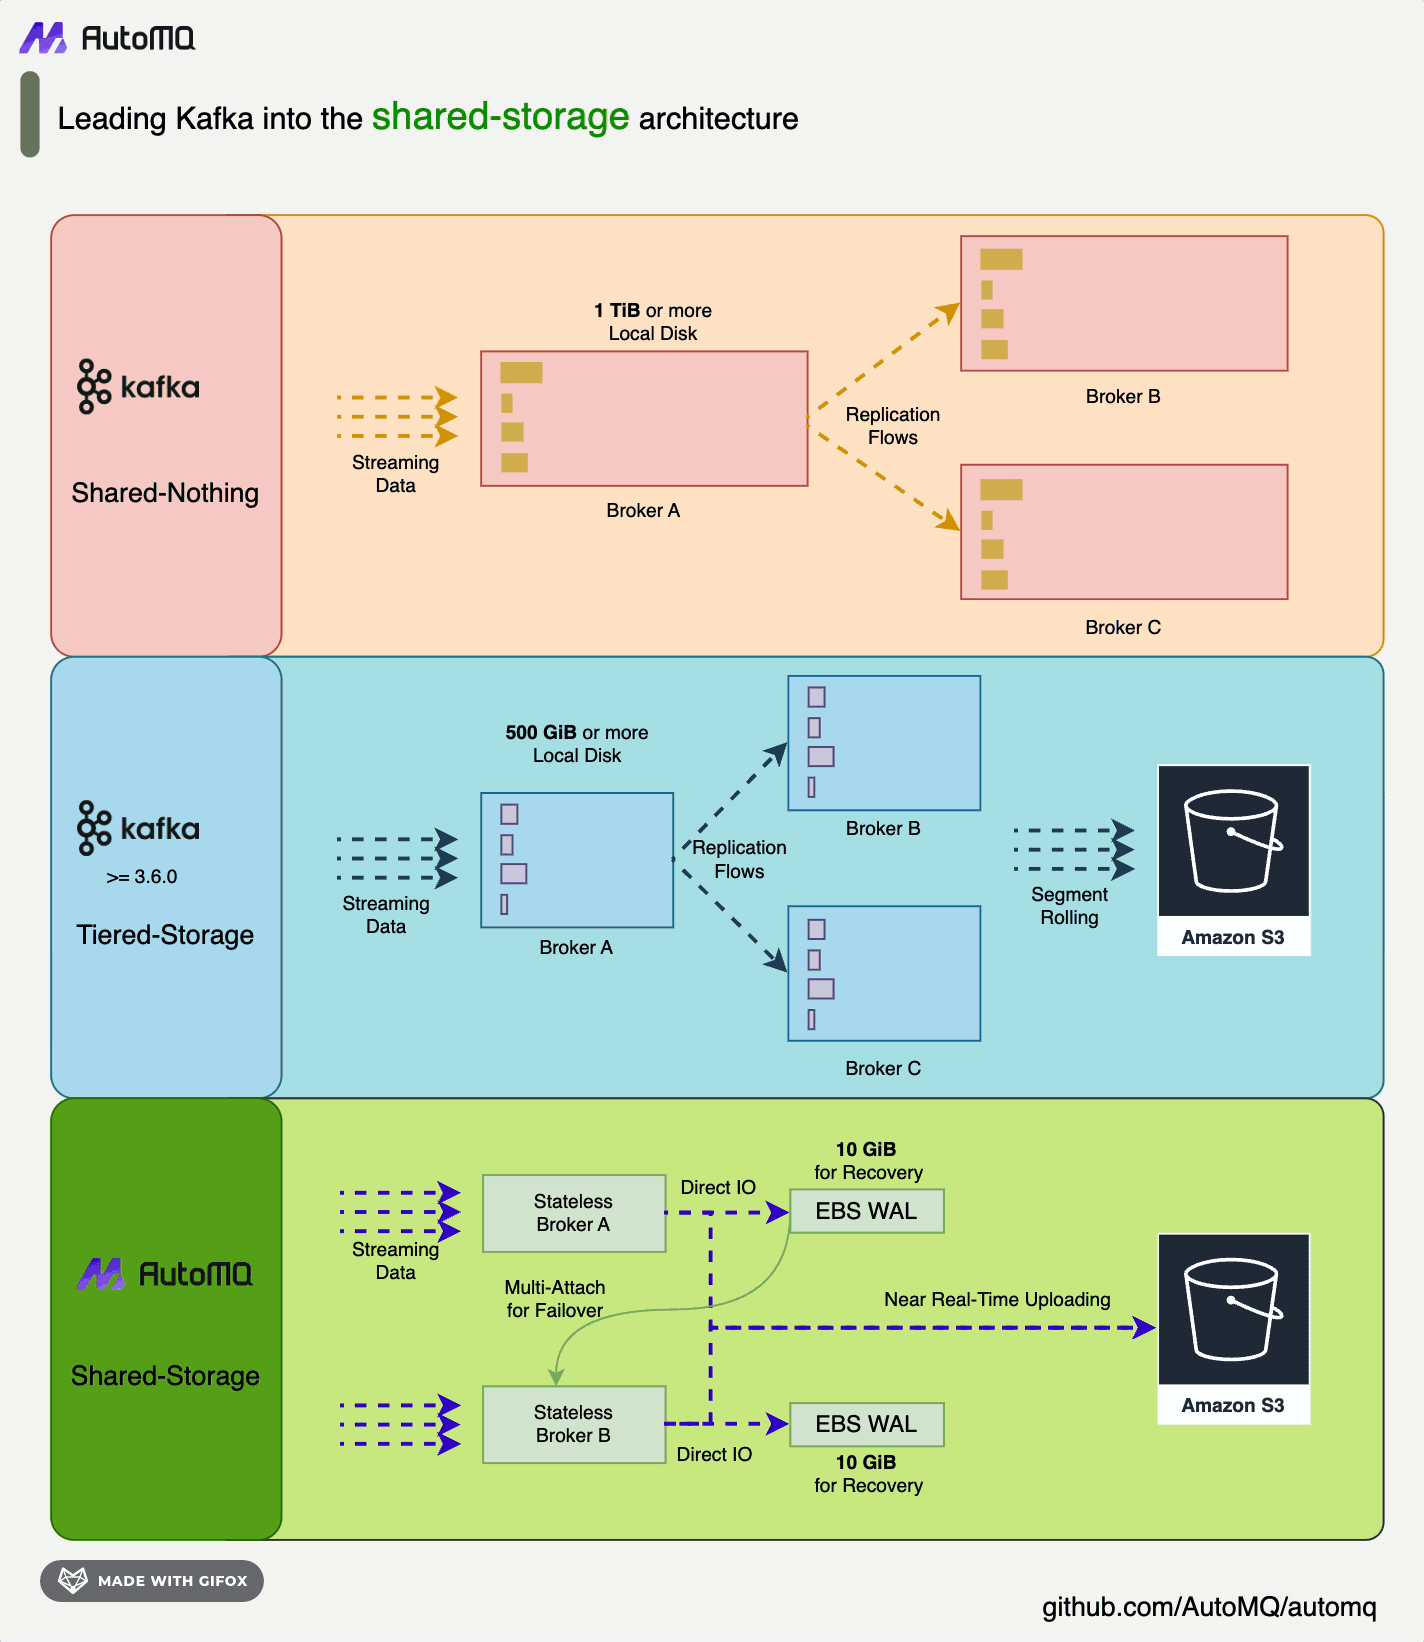
AutoMQ is a cloud-rearchitected stream processing system that maintains 100% compatibility with Apache Kafka® while significantly enhancing cost-efficiency and elasticity by decoupling storage to object storage. Specifically, AutoMQ offloads storage to shared cloud storage EBS and S3 provided by Cloud providers by building a stream repository on S3 called S3Stream. This approach provides low-cost, low-latency, high-availability, durability, and virtually unlimited capacity for stream storage. Compared to traditional Shared Nothing architecture, AutoMQ adopts a Shared Storage architecture, significantly reducing storage and operational complexity while enhancing system elasticity and reliability.
The design philosophy and technical advantages of AutoMQ make it an ideal choice for replacing existing Kafka clusters in enterprises. By adopting AutoMQ, enterprises can significantly reduce storage costs, simplify operations, and achieve automatic scaling and self-balancing of clusters, thereby more efficiently addressing changing business demands. Additionally, AutoMQ's architecture supports efficient cold read operations and zero-interruption service, ensuring stable operation of the system under high load and sudden traffic spikes.
Overview of Prometheus
Prometheus is an open-source system monitoring and alerting toolkit originally developed by SoundCloud and open-sourced in 2012. It features powerful data collection, storage, and query capabilities, enabling real-time monitoring of system and application performance metrics. Prometheus employs a multi-dimensional data model, labeling monitoring data and querying it with a flexible query language, PromQL. The primary advantages of Prometheus include efficient data collection, powerful querying capabilities, and a rich alerting mechanism, making it widely used in cloud-native ecosystems.
However, Prometheus has certain limitations when it comes to large-scale data storage, particularly in scenarios involving long-term storage and high-concurrency queries. Storage performance and query efficiency might be impacted under such conditions. Thus, an efficient storage backend needs to be introduced to address these issues.
VictoriaMetrics Overview
VictoriaMetrics is a high-performance, open-source time-series database designed for high-concurrency data writes and queries. It features efficient data compression and storage capabilities, allowing for high-throughput data writes and queries even with low hardware resource consumption. VictoriaMetrics supports Prometheus's remote storage interface and can seamlessly integrate into existing Prometheus monitoring infrastructures. The diagram below illustrates the architecture of VictoriaMetrics:
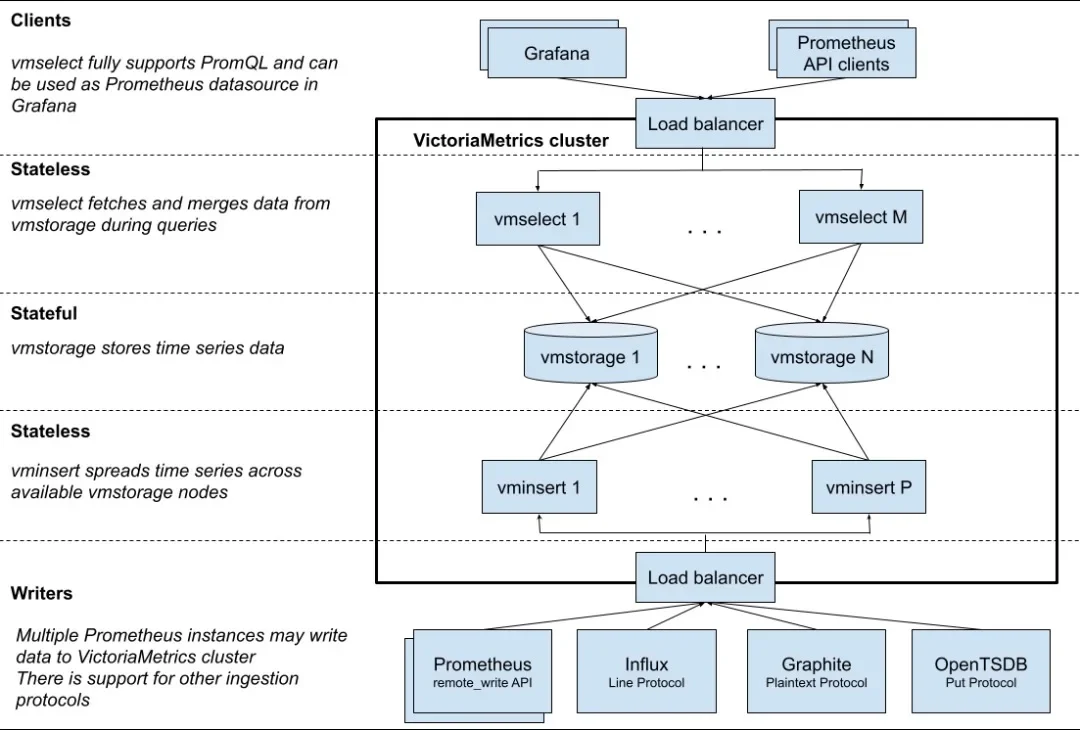
By using VictoriaMetrics as the storage backend for Prometheus, enterprises can significantly enhance the storage and query performance of their monitoring systems, meeting the demands of large-scale data storage and high-concurrency queries. Key advantages of VictoriaMetrics include efficient data compression, fast data queries, and low resource consumption, making it an ideal storage backend for Prometheus. Below, I will proceed with the deployment of AutoMQ, Prometheus, and VictoriaMetrics.
Prerequisites
-
Deploy a functional AutoMQ node/cluster and open the metrics collection port
-
Deploy VictoriaMetrics as the storage backend for Prometheus
-
Deploy Prometheus to collect metrics data
Deploy AutoMQ, VictoriaMetrics, Prometheus
Deploy AutoMQ
Refer to the AutoMQ documentation: [Cluster Deployment | AutoMQ] [5]. Before starting deployment, add the following configuration parameters to enable the Prometheus pull interface. After starting the AutoMQ cluster with these parameters, each node will additionally expose an HTTP interface for pulling AutoMQ monitoring metrics. The format of these metrics adheres to Prometheus Metrics standards.
bin/kafka-server-start.sh ...\
--override  s3.telemetry.metrics.exporter.type=prometheus \
--override  s3.metrics.exporter.prom.host=0.0.0.0 \
--override  s3.metrics.exporter.prom.port=8890 \
....
When AutoMQ monitoring metrics are enabled, you can pull Prometheus-formatted metrics from any node using the HTTP protocol at the address: http://{node_ip}:8890. An example of the response is as follows:
....
kafka_request_time_mean_milliseconds{otel_scope_name="io.opentelemetry.jmx",type="DescribeDelegationToken"} 0.0 1720520709290
kafka_request_time_mean_milliseconds{otel_scope_name="io.opentelemetry.jmx",type="CreatePartitions"} 0.0 1720520709290
...
For a detailed introduction to the metrics, refer to the official AutoMQ documentation: [Metrics | AutoMQ] [6].
Deploy VictoriaMetrics
Refer to the documentation: [VictoriaMetrics] [7]. VictoriaMetrics supports binary versions, Docker images, and source code deployment. Here we choose to deploy using Docker. Start the VictoriaMetrics container by executing the following command and map the data files to the folder /home/VictoriaMetrics/data for easy access and monitoring of data import changes:
# Create the data directory
sudo mkdir -p /home/VictoriaMetrics/data
# Docker start command, mounting the data directory
docker run -d --name victoria-metrics \
-p 8428:8428 \
-v /home/VictoriaMetrics/data:/victoria-metrics-data \
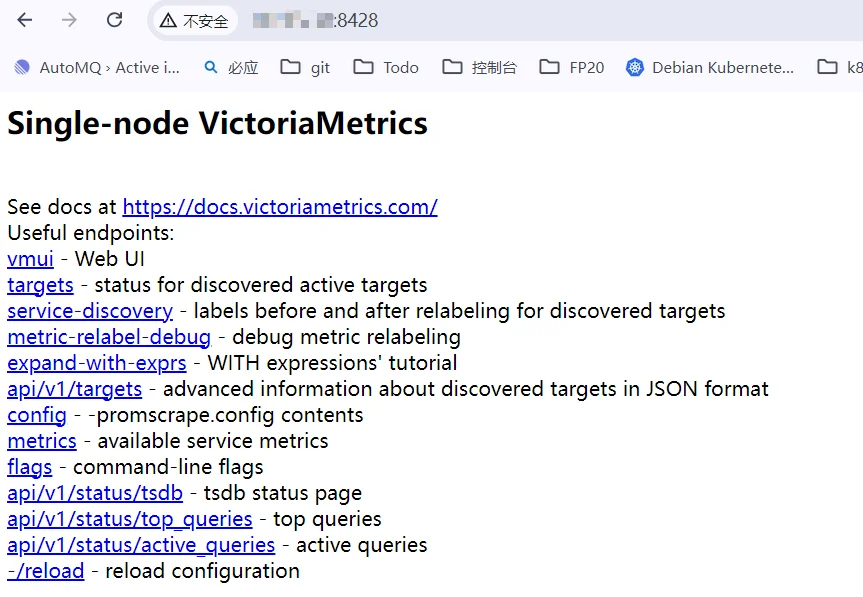
victoriametrics/victoria-metricsVerify the installation is successful by accessing it through a browser at: http://{client_ip}:8428
Deploy Prometheus
Prometheus can be deployed by downloading the binary package or using Docker. Below are the instructions for these two deployment methods.
Binary Deployment
For convenience, you can create a new script and modify the Prometheus download version as needed. Finally, execute the script to complete the deployment. First, create a new script:
cd /home
vim install_prometheus.sh
# !!! Paste the script content below and save/exit
# Grant permissions
chmod +x install_prometheus.sh
# Run the script
./install_prometheus.sh
The script content is as follows:
version=2.45.3
filename=prometheus-${version}.linux-amd64
mkdir -p /opt/prometheus
wget https://github.com/prometheus/prometheus/releases/download/v${version}/${filename}.tar.gz
tar xf ${filename}.tar.gz
cp -far ${filename}/*  /opt/prometheus/

# config as a service
cat <<EOF >/etc/systemd/system/prometheus.service
[Unit]
Description="prometheus"
Documentation=https://prometheus.io/
After=network.target

[Service]
Type=simple

ExecStart=/opt/prometheus/prometheus --config.file=/opt/prometheus/prometheus.yml --storage.tsdb.path=/opt/prometheus/data --web.enable-lifecycle --web.enable-remote-write-receiver

Restart=on-failure
SuccessExitStatus=0
LimitNOFILE=65536
StandardOutput=syslog
StandardError=syslog
SyslogIdentifier=prometheus

[Install]
WantedBy=multi-user.target
EOF

systemctl enable prometheus
systemctl restart prometheus
systemctl status prometheus
Subsequently, modify the configuration file of Prometheus to add the task for collecting observable data from AutoMQ and restart Prometheus by executing the command:
# Fill the config file content with the following
vim /opt/prometheus/prometheus.yml
# Restart Prometheus
systemctl restart prometheus
Refer to the configuration file content below. Please change `client_ip` to the address where AutoMQ exposes observable data:
# my global config
global:
scrape_interval: 15s # Set the scrape interval to every 15 seconds. Default is every 1 minute.
evaluation_interval: 15s # Evaluate rules every 15 seconds. The default is every 1 minute.
scrape_configs:
# The job name is added as a label `job=<job_name>` to any timeseries scraped from this config.
- job_name: "prometheus"
static_configs:
- targets: ["localhost:9090"]
- job_name: "automq"
static_configs:
- targets: ["{client_ip}:8890"]
# config victoriaMetrics IO port
remote_write:
- url: "http://{client_ip}:8428/api/v1/write"
remote_read:
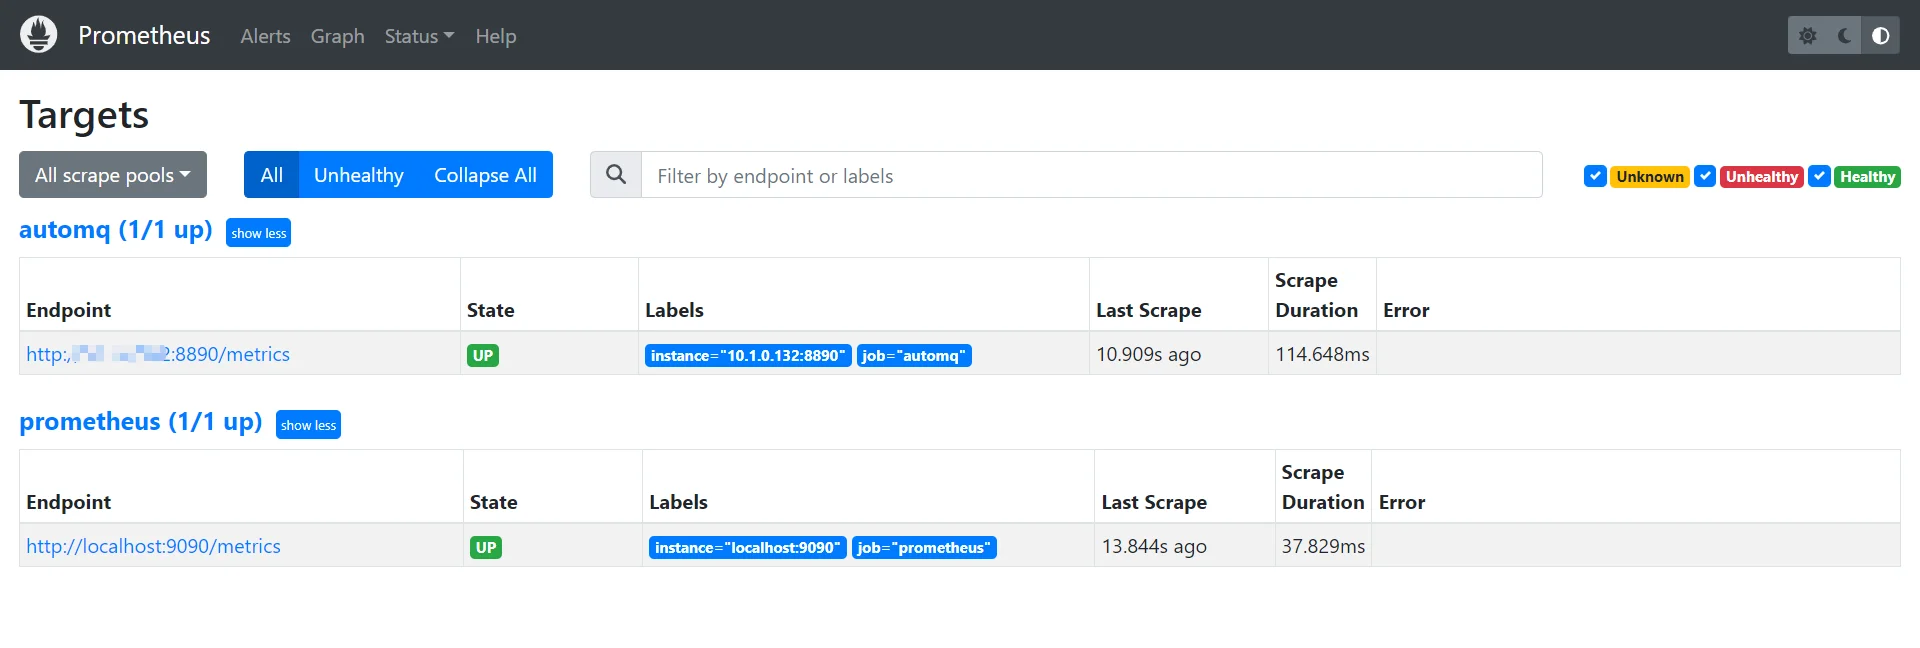
- url: "http://{client_ip}:8428/api/v1/read"Once the deployment is completed, we can access Prometheus through a browser to check whether the AutoMQ metrics have been successfully collected by visiting http://{client_ip}:9090/targets:
Docker Deployment
If you already have a running Prometheus Docker container, please execute the command to remove that container:
docker stop prometheus
docker rm prometheus
Create a new configuration file and mount it when starting Docker:
mkdir -p /opt/prometheus
vim /opt/prometheus/prometheus.yml
# Refer to the configuration content in the "Binary Deployment" section above
Start the Docker container:
docker run -d \
  --name=prometheus \
  -p 9090:9090 \
  -v /opt/prometheus/prometheus.yml:/etc/prometheus/prometheus.yml \
  -m 500m \
  prom/prometheus \
  --config.file=/etc/prometheus/prometheus.yml \
  --enable-feature=otlp-write-receiver \
  --web.enable-remote-write-receiver
This way, you will have a Prometheus service that collects AutoMQ Metrics. For more information on integrating AutoMQ Metrics with Prometheus, refer to: [Integrating Metrics into Prometheus | AutoMQ] [8].
Verify the integration results.
VictoriaMetrics Data Verification
VictoriaMetrics offers a Dashboard that can be accessed via http://{client_ip}:8428/vmui for a graphical interface. The basic usage includes:
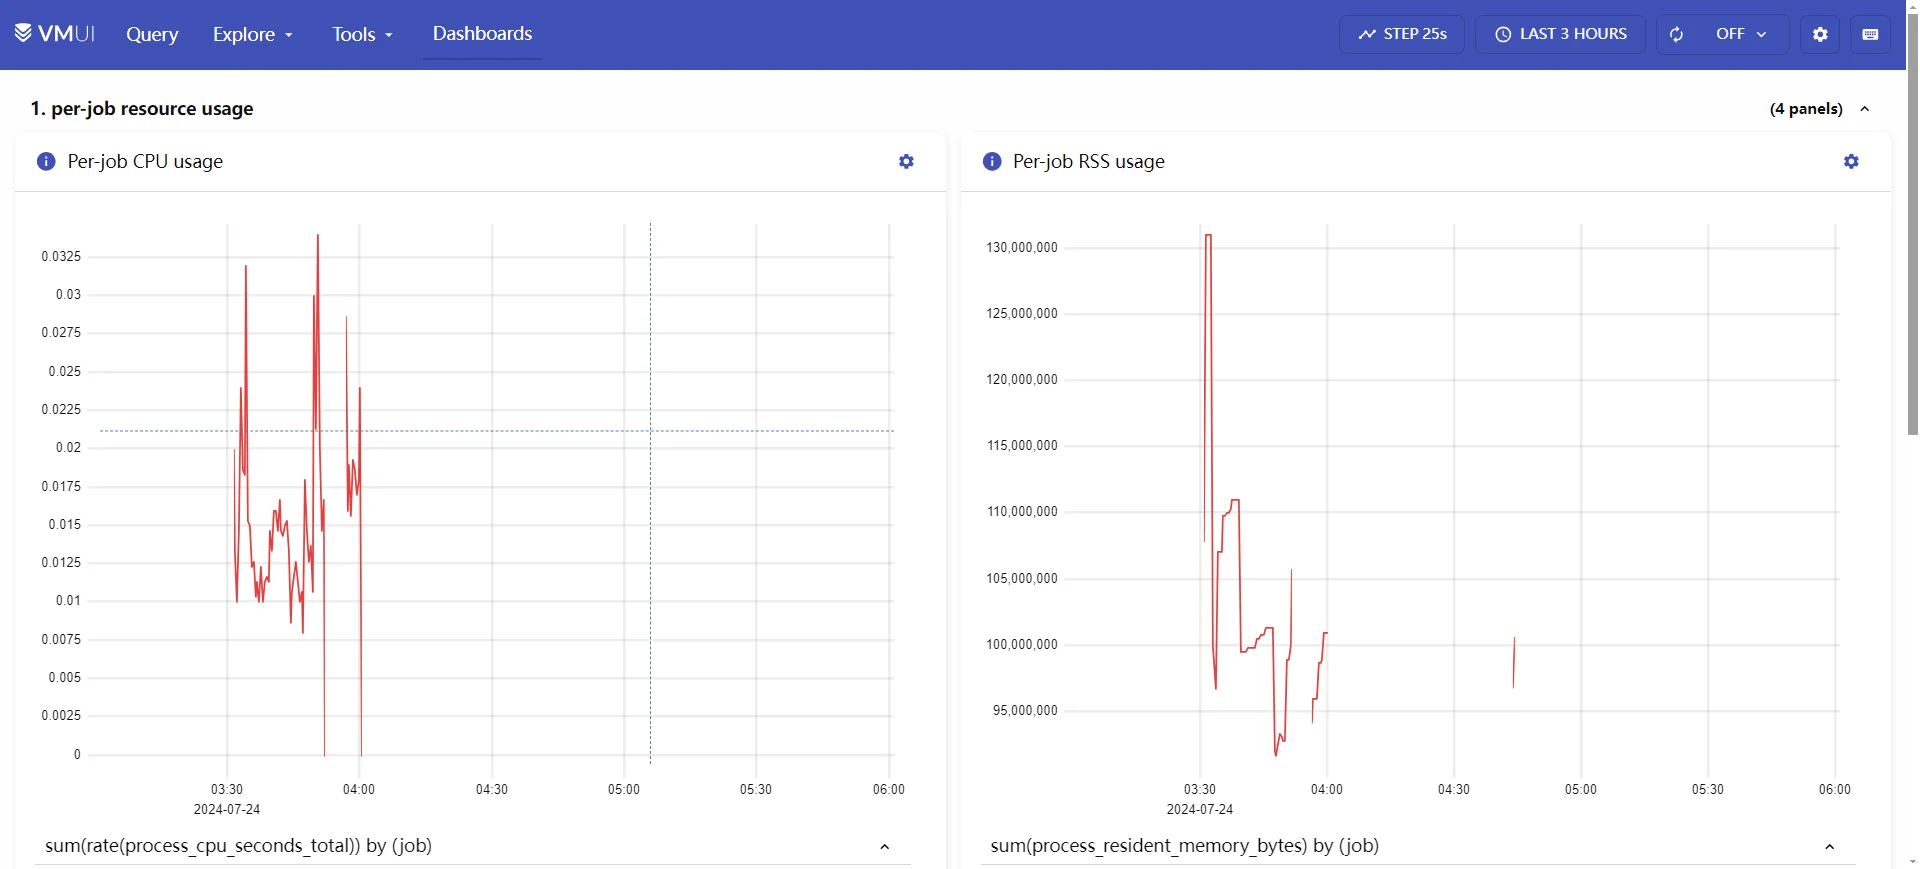
Data file verification. By checking the data folder, the corresponding data files can be found:
root@debian: ls /home/VictoriaMetrics/data/small/2024_07/
17E5088F4DC9C068  17E5088F4DC9C073  17E5088F4DC9C0B3  17E509EE0189D399  17E509EE0189D39C  17E509EE0189D39F  17E509EE0189D3A2  17E509EE0189D3A5
17E5088F4DC9C06A  17E5088F4DC9C075  17E509EE0189D38D  17E509EE0189D39A  17E509EE0189D39D  17E509EE0189D3A0  17E509EE0189D3A3  17E509EE0189D3A6
17E5088F4DC9C071  17E5088F4DC9C07B  17E509EE0189D398  17E509EE0189D39B  17E509EE0189D39E  17E509EE0189D3A1  17E509EE0189D3A4  parts.json
By accessing the status at http://{client_ip}:8428/api/v1/status/tsdb, a JSON file can be retrieved:
"status": "success",
    "data": {
        "totalSeries": 3125,
        "totalLabelValuePairs": 15564,
        "seriesCountByMetricName": [
            {
                "name": "prometheus_http_request_duration_seconds_bucket",
                "value": 150
            },
            {
                "name": "prometheus_http_response_size_bytes_bucket",
                "value": 135
            },
            {
                "name": "kafka_request_queue_time_50p_milliseconds",
                "value": 90
            },
...............
Grafana dashboard (optional)
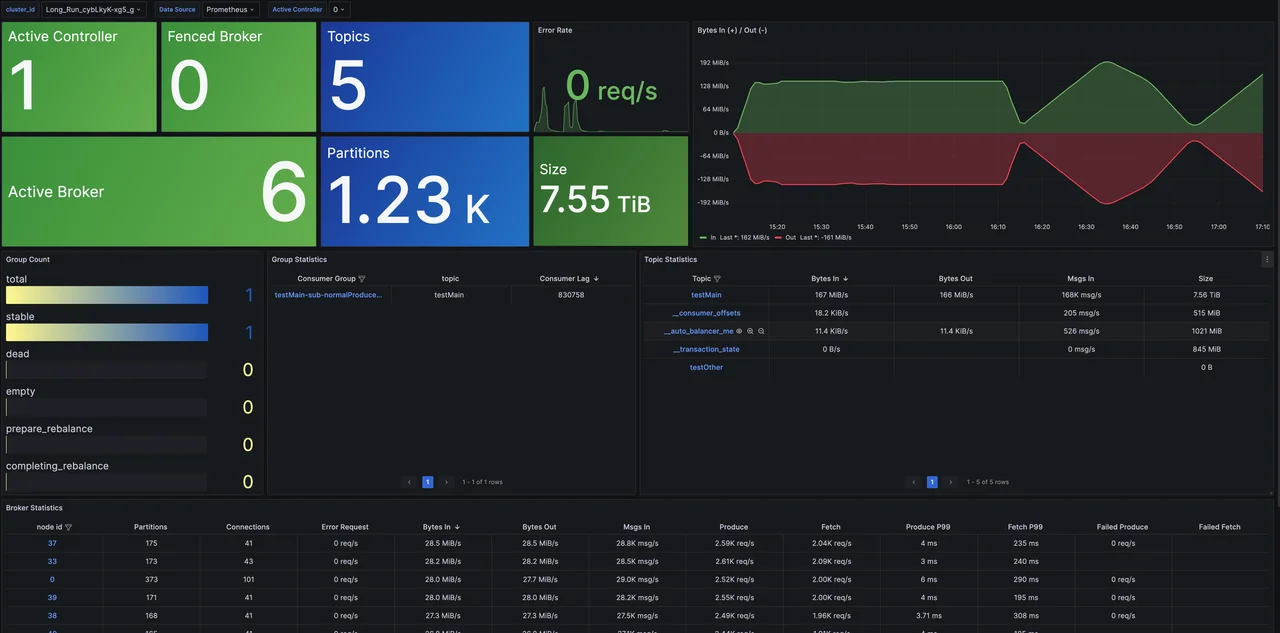
Since we have already adopted VictoriaMetrics as the storage backend for Prometheus, we can also use it as a data source for Grafana at http://{client_ip}:8428 to obtain the status information of the AutoMQ cluster. For Grafana template files, you can refer to the official AutoMQ templates: [grafana] [9]. The final demonstration will look like this:
Cluster Overview: Provides cluster-level monitoring information, including metrics such as the number of nodes, data size, and cluster traffic. Additionally, it offers overview metrics for Topic, Group, Broker dimensions and supports drill-down capabilities for detailed monitoring data.
With this, our integration process concludes. For more exploratory functions, please refer to the VictoriaMetrics [official documentation] [10].
Summary
Through this article, we have discussed in detail how to integrate AutoMQ, Prometheus, and VictoriaMetrics to achieve comprehensive monitoring of the AutoMQ cluster. We first introduced the functions and advantages of each component, explained why Prometheus was chosen as the monitoring system and why VictoriaMetrics is needed as the storage backend for Prometheus. Then, we walked through deploying and configuring AutoMQ, VictoriaMetrics, and Prometheus step by step and validated the integration effect.
Through this integration solution, enterprises can achieve the following advantages:
-
Efficient Data Collection and Storage: Prometheus ensures efficient data collection, while VictoriaMetrics provides effective data storage and compression capabilities, allowing the system to store vast amounts of time-series data with minimal hardware resource consumption.
-
Fast Data Querying: VictoriaMetrics offers high-performance data querying, capable of handling high concurrency query demands, ensuring efficient querying in large-scale data storage scenarios.
-
Seamless Integration: VictoriaMetrics supports Prometheus's remote storage interface, enabling seamless integration into existing Prometheus monitoring systems, enhancing overall system performance and stability.
By leveraging this integration, enterprises can achieve comprehensive monitoring of AutoMQ clusters, ensuring high availability and performance optimization of the system, promptly identifying and resolving potential issues, and optimizing system performance to ensure business continuity and stability. In the future, as business demands evolve and technology progresses, further exploration and optimization of monitoring solutions can be pursued to meet more complex application scenarios and higher performance requirements.
References
[1] AutoMQ: https://www.automq.com
[2] Prometheus: https://prometheus.io/docs/prometheus/latest/getting_started/
[3] VictoriaMetrics: https://docs.victoriametrics.com/
[4] VictoriaMetrics Structure: https://docs.victoriametrics.com/cluster-victoriametrics/
[5] Cluster Deployment | AutoMQ: https://docs.automq.com/zh/automq/getting-started/cluster-deployment-on-linux
[6] Metrics | AutoMQ: https://docs.automq.com/zh/automq/observability/metrics
[7] VictoriaMetrics Installation Guide: https://docs.victoriametrics.com/
[8] Integrating Metrics with Prometheus: https://docs.automq.com/zh/automq/observability/integrating-metrics-with-prometheus
[9] grafana: https://github.com/AutoMQ/automq/tree/main/docker/telemetry/grafana/provisioning/dashboards
[10] Official VictoriaMetrics Documentation: https://docs.victoriametrics.com/


