.png)
Introduction to Kafka Monitoring
Kafka monitoring involves the continuous tracking, analysis, and visualization of various metrics and events within a Kafka cluster to gain insights into its performance and health. This process is crucial for maintaining the stability and efficiency of real-time data pipelines and streaming applications.
Key Concepts in Kafka Monitoring
Metrics : Key metrics include message throughput, latency, broker resource utilization, consumer lag, and topic/partition metrics. These are essential for identifying issues and optimizing performance.
Tools : Popular monitoring tools include Prometheus, Grafana, Datadog etc. These tools help in collecting, visualizing, and alerting on Kafka metrics. Many Kafka UIs offer the ability to view Kafka metrics. You can check them here: Top 12 Free Kafka GUI Tools 2025
Advanced Monitoring : Beyond basic metrics, advanced monitoring involves tracking replication, failover, network performance, and security aspects.
How Kafka Monitoring Works
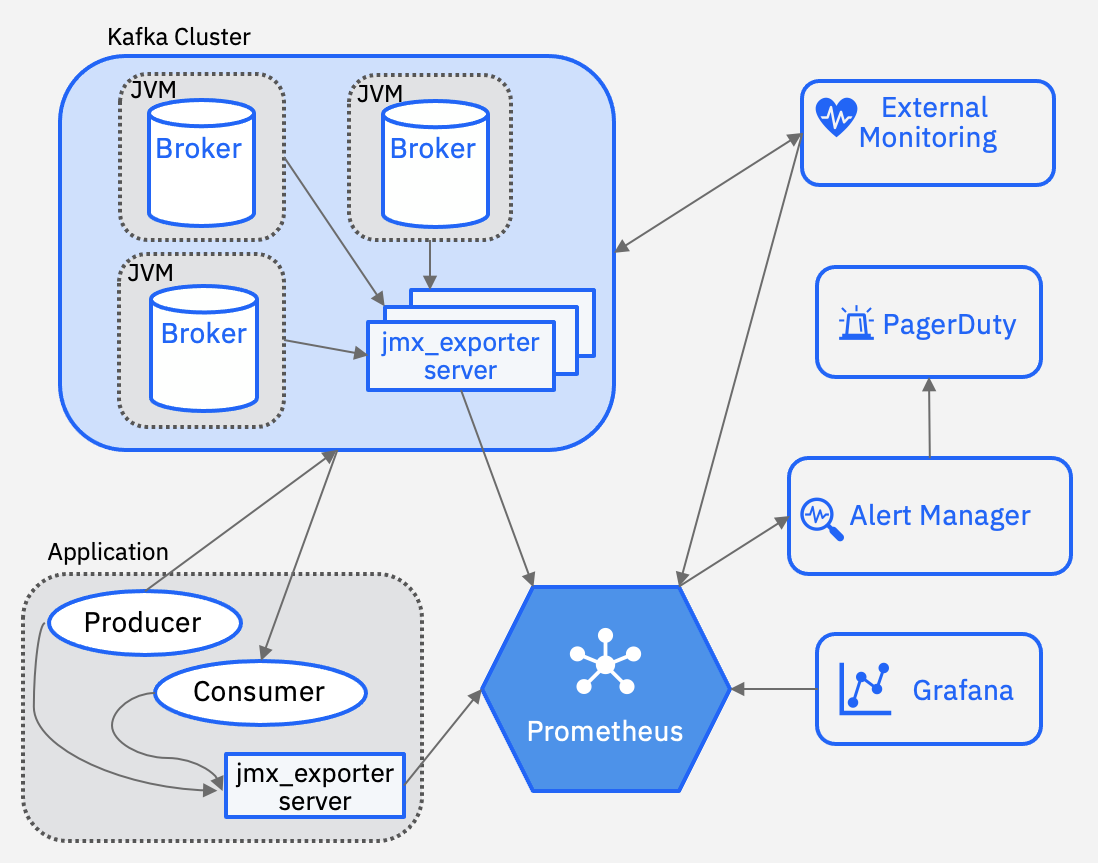
Data Collection : Kafka provides built-in APIs like the Metrics API and AdminClient API to collect metrics. Tools like Prometheus scrape these metrics periodically.
Data Visualization : Tools like Grafana are used to create dashboards that visualize Kafka metrics in real-time, providing insights into cluster health and performance.
Alerting and Notifications : Alerts are set up for critical metrics to notify administrators of anomalies or performance issues, ensuring timely intervention.
Best Practices for Kafka Monitoring
Regular Monitoring
Continuous Checks : Regularly monitor key metrics to ensure cluster stability and performance.
Proactive Approach : Identify issues before they escalate to maintain reliability.
Alerting and Notifications
Configure Alerts : Set alerts for throughput, latency, and consumer lag to detect anomalies early.
Notification Channels : Use email, Slack, or similar platforms for prompt notifications.
Advanced Practices
Unify Metrics and Logs : Integrate metrics and logs for a comprehensive view of cluster health.
Data-Driven Decisions : Use monitoring data for capacity planning and performance tuning.
Community Engagement : Stay updated with the latest techniques and tools through community engagement.
What optimizations has AutoMQ made for Kafka monitoring?
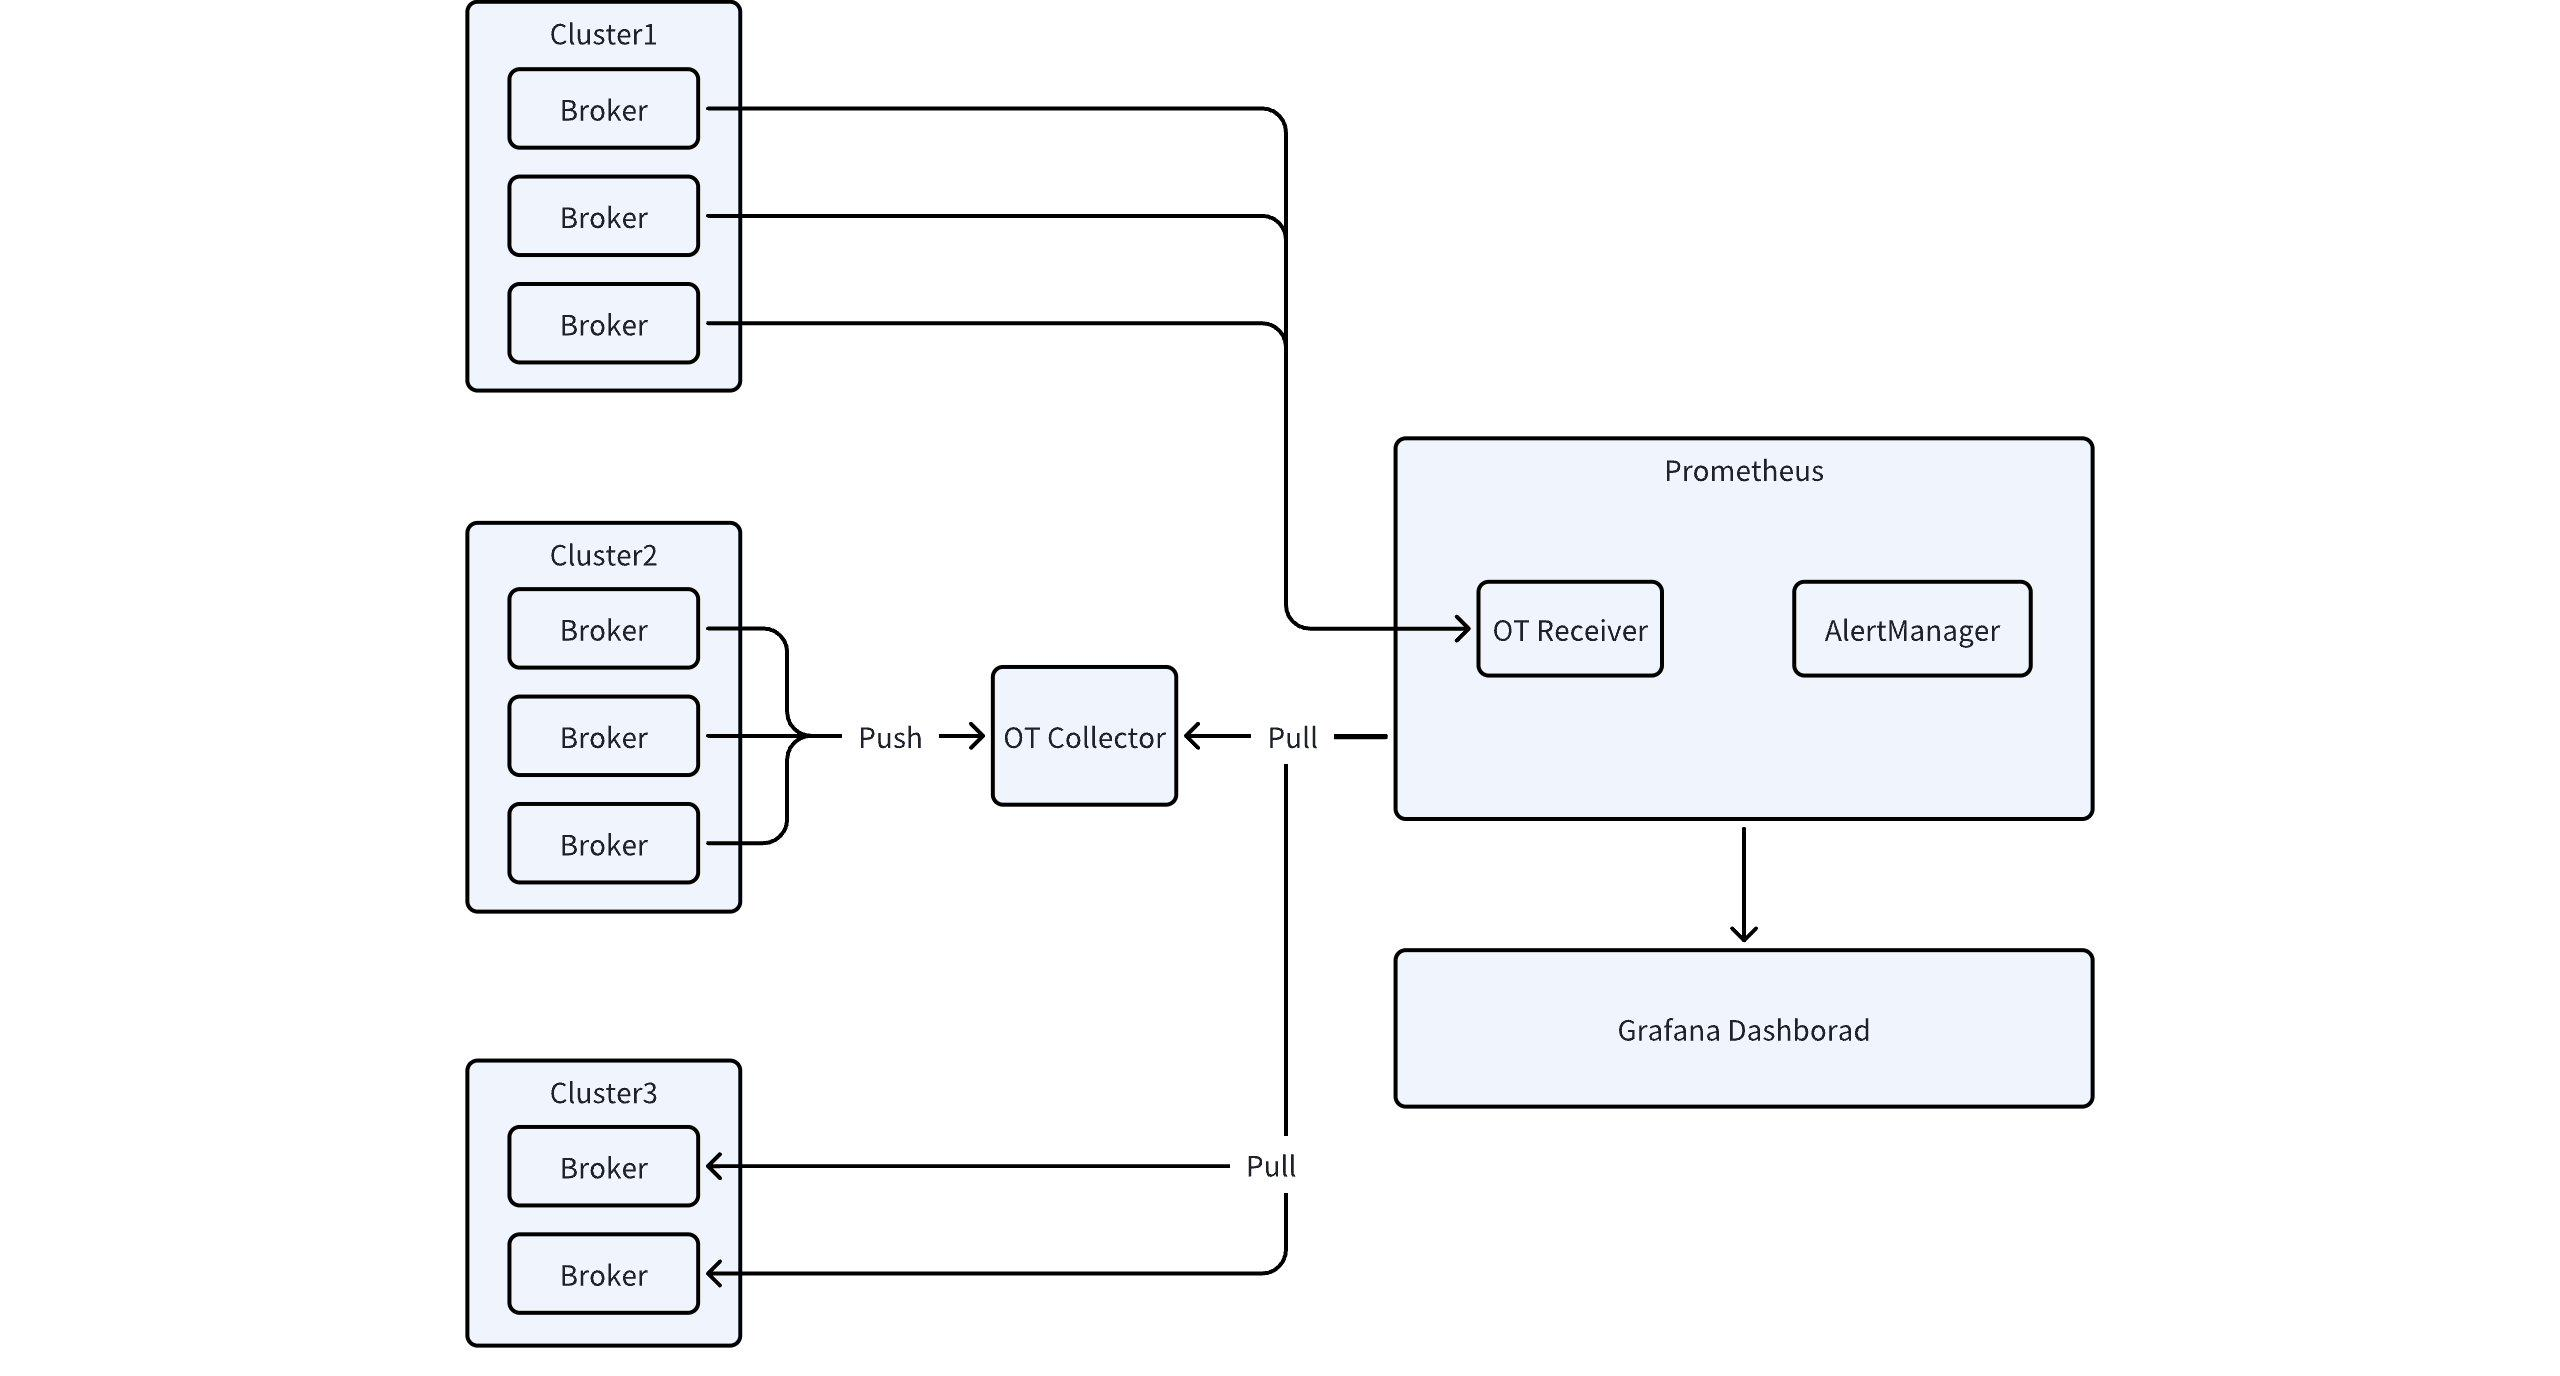
AutoMQ is a next-generation Kafka that's 100% compatible and built on top of S3. By default, Apache Kafka exposes metrics exclusively through Java Management Extensions (JMX), which represents an increasingly outdated approach in the modern monitoring landscape. This legacy mechanism often presents significant challenges for integration with contemporary observability stacks. AutoMQ addresses this limitation by enhancing monitoring capabilities and providing seamless integration with modern observability systems through the support of the OpenTelemetry Protocol (OTLP). This advancement allows for the comprehensive exposure of all Kafka metrics via OTLP, enabling more flexible and powerful monitoring solutions. The OTLP protocol offers improved interoperability with various monitoring platforms and facilitates a more standardized approach to metrics collection and analysis. For detailed information on implementation and configuration options, please refer to the comprehensive documentation: Integrating Kafka Metrics with Prometheus.
References
[1] Monitoring Apache Kafka applications: https://developer.ibm.com/learningpaths/develop-kafka-apps/getting-to-production/monitoring-kafka/