Kafka monitoring is essential for maintaining healthy data streaming ecosystems, and Burrow stands out as a purpose-built monitoring solution for tracking consumer lag without relying on arbitrary thresholds. Created by LinkedIn and released as open-source software, Burrow has become a crucial tool for organizations relying on Kafka for their streaming data needs. This comprehensive guide explores Burrow's architecture, setup process, configuration options, best practices, and integration capabilities to help you effectively monitor your Kafka infrastructure.
Understanding Burrow and Its Importance
Burrow fundamentally transforms how we approach Kafka consumer monitoring by providing an objective view of consumer status based on offset commitments and broker state. Unlike traditional monitoring solutions that rely on fixed thresholds, Burrow evaluates consumer behavior over a sliding window, making it more effective at detecting real problems while reducing false alarms.
Core Concepts of Burrow
Burrow operates by consuming the special internal Kafka topic to which consumer offsets are written, providing a centralized service that monitors all consumers across all partitions they consume. It examines several crucial factors:
-
Whether consumers are committing offsets
-
If consumer offset commits are increasing
-
Whether lag is increasing
-
If lag is increasing consistently or fluctuating
Based on this evaluation, Burrow assigns each partition a status (OK, WARNING, or ERROR) and then distills these individual statuses into a single consumer group status, providing a holistic view of consumer health.
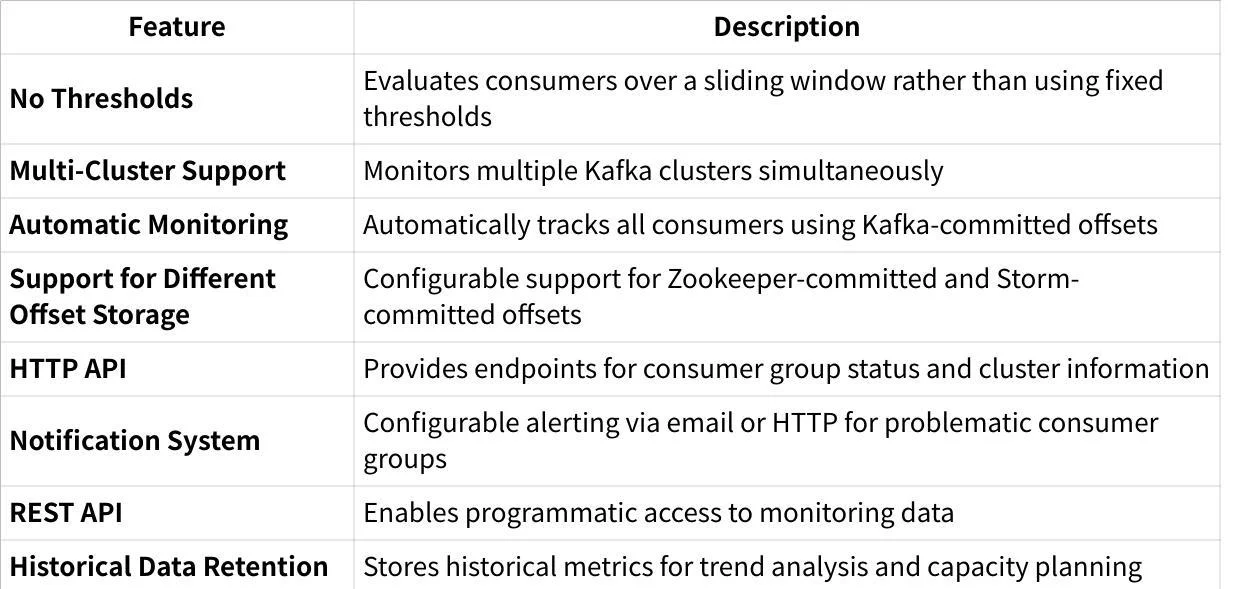
Key Features of Burrow
Burrow offers a robust set of features that make it particularly valuable for Kafka monitoring:
Burrow Architecture and Components
Burrow employs a modular design that separates responsibilities into distinct subsystems, each handling a specific aspect of monitoring:
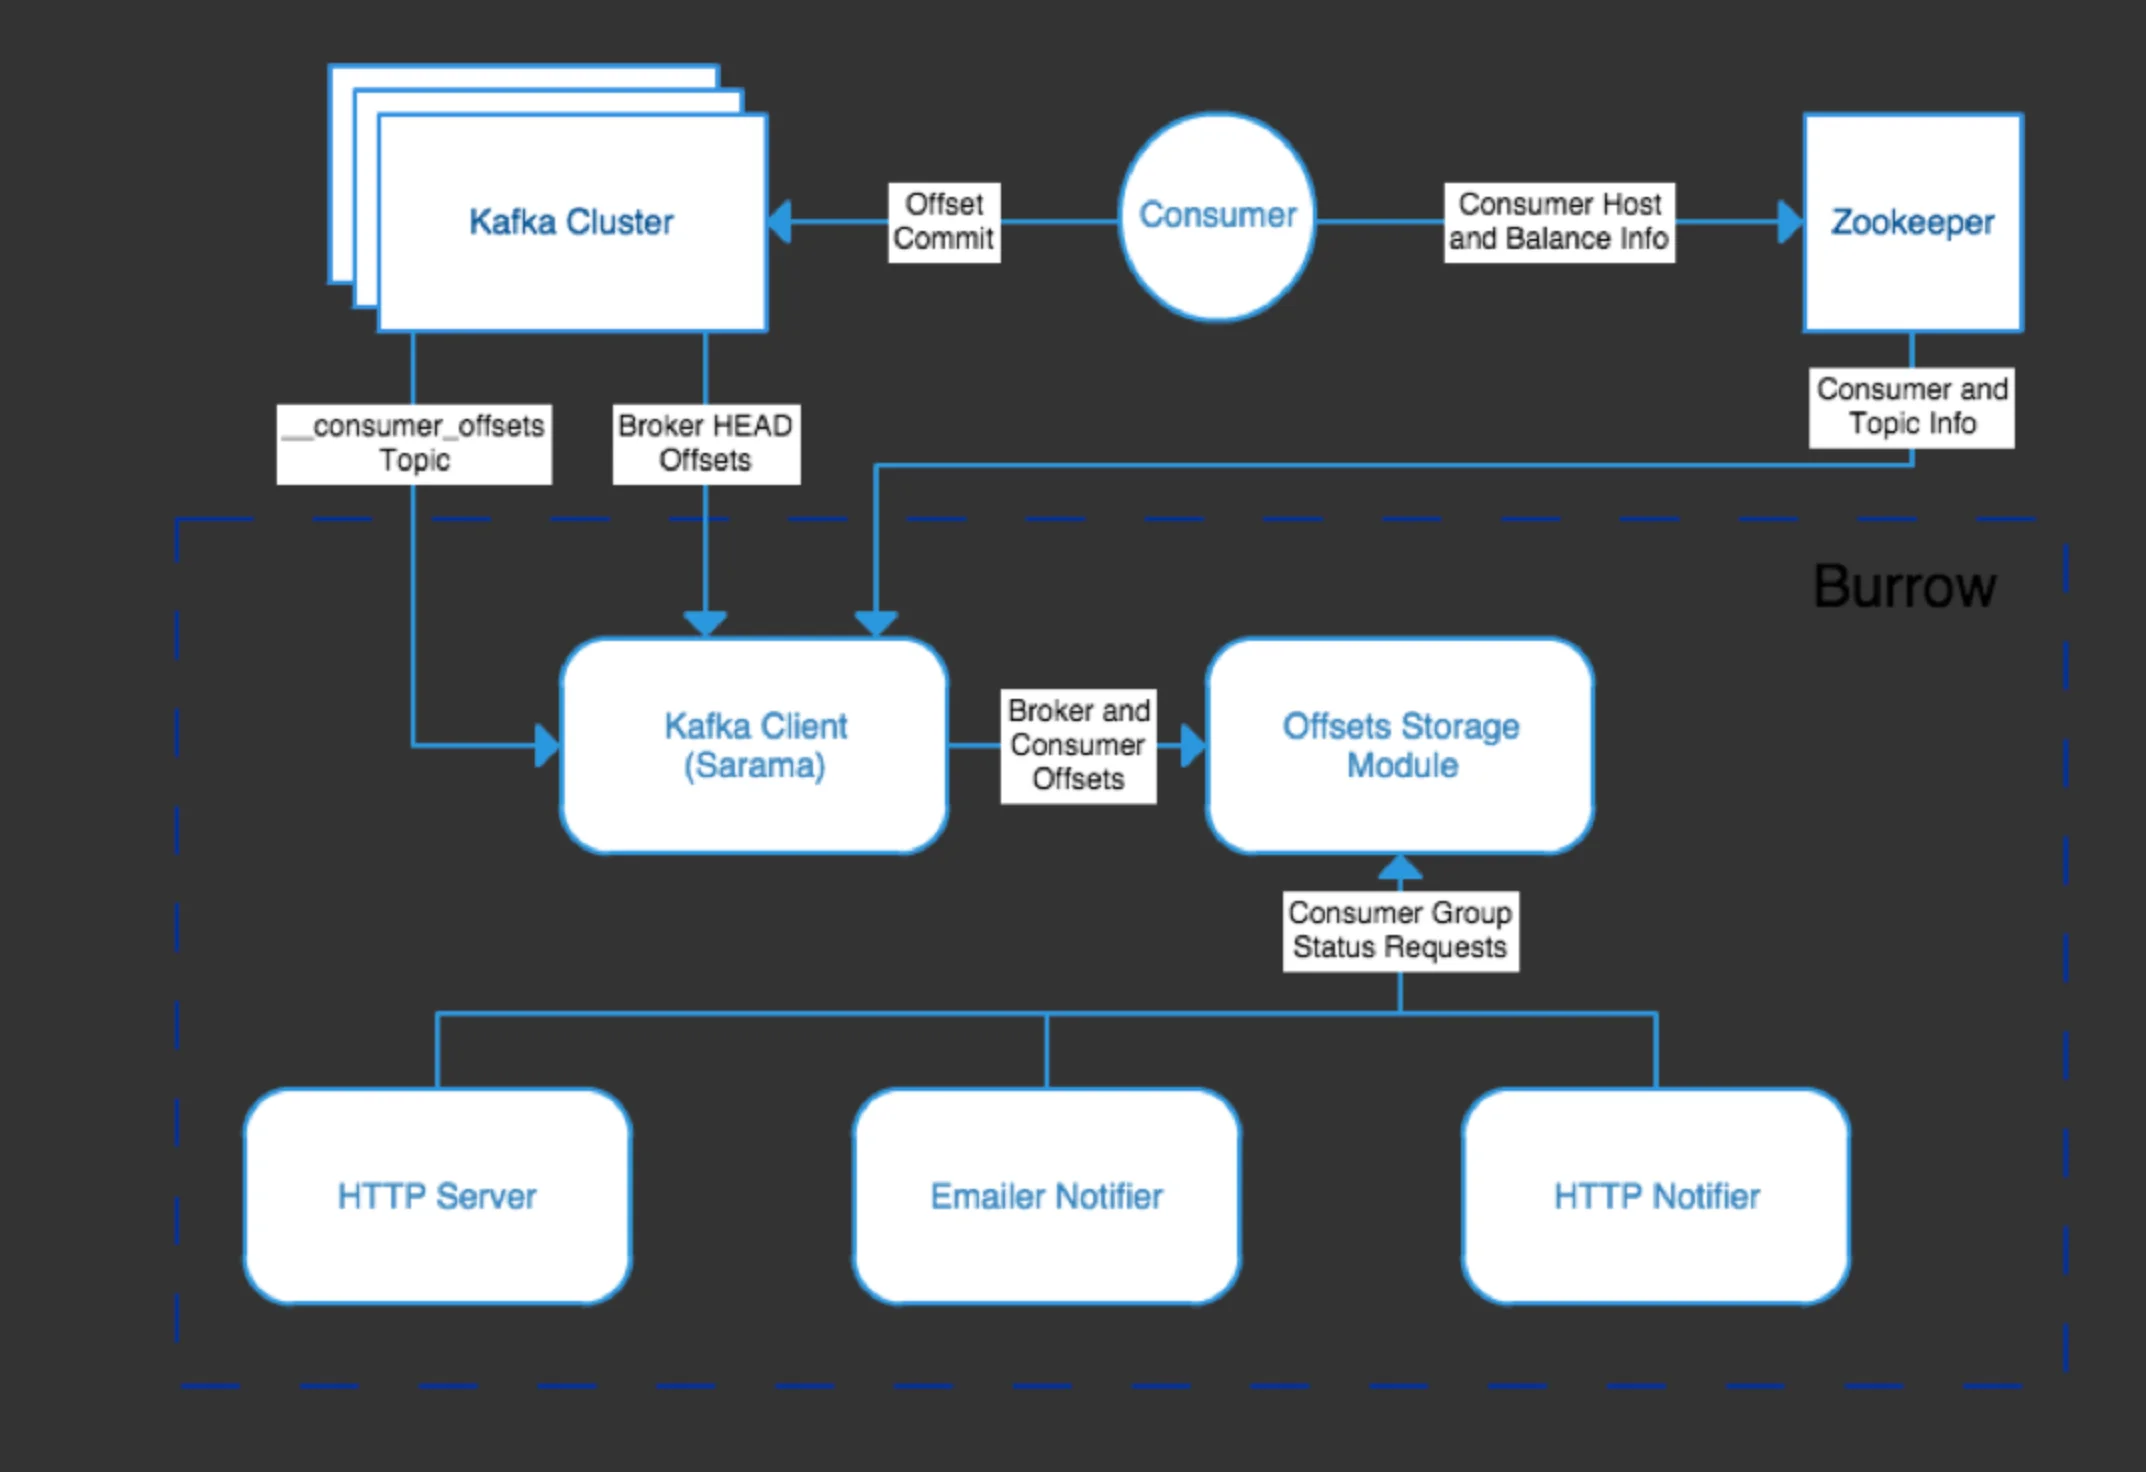
Clusters Subsystem
The Clusters subsystem runs Kafka clients that periodically update topic lists and track the current HEAD offset (most recent offset) for every partition. This provides the baseline for measuring consumer lag.
Consumers Subsystem
The Consumers subsystem fetches information about consumer groups from repositories like Kafka clusters (consuming the __consumer_offsets topic) or Zookeeper. This data includes details about which consumers are active and what offsets they've committed.
Storage Subsystem
The Storage subsystem maintains all the information gathered by the Clusters and Consumers subsystems. It provides this data to other subsystems when requested for evaluation and notification purposes.
Evaluator Subsystem
The Evaluator subsystem retrieves information from Storage for specific consumer groups and calculates their status following consumer lag evaluation rules. This is where Burrow's threshold-free approach is implemented.
Notifier Subsystem
The Notifier subsystem periodically requests status information on consumer groups and sends notifications (via Email, HTTP, or other methods) for groups meeting configured criteria. This enables proactive monitoring and alerts.
HTTP Server Subsystem
The HTTP Server subsystem provides an API interface for retrieving information about clusters and consumers, making Burrow's data accessible to external systems and dashboards.
Setting Up and Configuring Burrow
Setting up Burrow involves several steps, with multiple deployment options available depending on your environment and requirements.
Using Docker Compose
The simplest way to get started with Burrow is using Docker Compose:
docker-compose up --build -dThis command uses the Docker Compose file to install Apache ZooKeeper, Kafka, and Burrow, with some test topics created by default.
Building from Source with Go
As Burrow is written in Go, you can also build it from source:
-
Install Go on your system
-
Download Burrow from the GitHub repository
-
Configure Burrow using a YAML file
-
Build and run the binary:
export GO111MODULE=on
go mod tidy
go install
$GOPATH/bin/Burrow --config-dir /path/containing/config
Basic Configuration
Burrow uses the viper configuration framework for Golang applications. A minimal configuration file might look like this:
zookeeper:
  servers:
    - "localhost:2181"
  timeout: 3

kafka:
  brokers:
    - "localhost:9092"

burrow:
  logdir: /var/log/burrow

storage:
  local:
    path: /var/lib/burrow

client-id: burrow-client
cluster-name: local

consumer-groups:
  - "burrow-test-consumer-group"

httpserver:
  address: "localhost:8000"
This configuration connects to a local Zookeeper and Kafka instance, specifies storage locations, and sets up a basic HTTP server.
Advanced Configuration Options
For production deployments, you might want to configure additional features:
-
Security settings for SASL and SSL
-
Multiple Kafka clusters for centralized monitoring
-
Notification configurations for alerts via email or HTTP
-
Customized HTTP API settings for integration with other systems
Interacting with Burrow
Once Burrow is running, you can interact with it in several ways to monitor your Kafka infrastructure.
Using the REST API
Burrow exposes several REST API endpoints that provide information about Kafka clusters, consumer groups, and their status. Some key endpoints include:
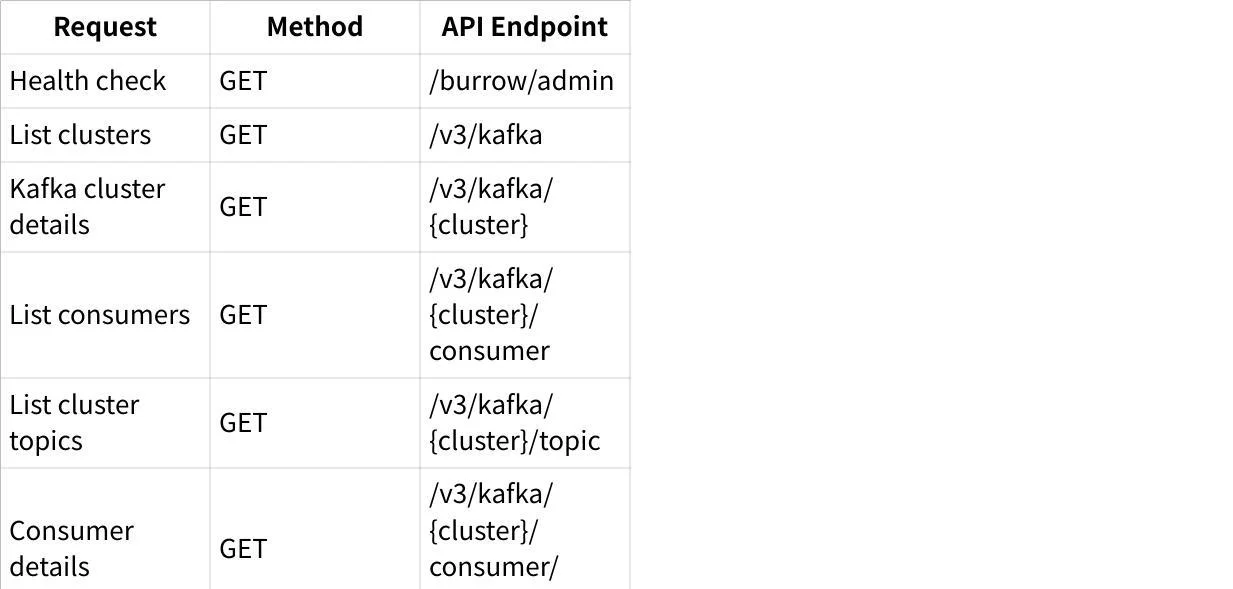
The most important endpoint for monitoring is the consumer group status endpoint, which returns detailed information about the status of a consumer group, including which partitions are lagging.
Using Dashboard UIs
While Burrow itself doesn't include a dashboard, several open-source projects provide front-end interfaces:
- BurrowUI : A simple dashboard that can be installed via Docker:
docker pull generalmills/burrowui
docker run -p 80:3000 -e BURROW_HOME="http://localhost:8000/v3/kafka" -d generalmills/burrowui- Burrow Dashboard : Another option that can be deployed with:
docker pull joway/burrow-dashboard
docker run --network host -e BURROW_BACKEND=http://localhost:8000 -d -p 80:80 joway/burrow-dashboard:latest
Integration with Monitoring Tools
Burrow can be integrated with popular monitoring tools to enhance visibility and alerting capabilities.
Prometheus and Grafana
Using Burrow Exporter, you can export Burrow metrics to Prometheus and visualize them in Grafana dashboards:
-
Install Burrow Exporter
-
Configure it to scrape metrics from Burrow
-
Set up Prometheus to collect metrics from the exporter
-
Create Grafana dashboards to visualize the metrics
InfluxDB and Telegraf
The Burrow Telegraf Plugin allows integration with InfluxDB:
[[inputs.burrow]]
  servers = ["http://localhost:8000"]
  # api_prefix = "/v3/kafka"
  # response_timeout = "5s"
  # concurrent_connections = 20
  # clusters_include = []
  # clusters_exclude = []
  # groups_include = []
  # groups_exclude = []
  # topics_include = []
  # topics_exclude = []
This configuration enables Telegraf to collect Burrow metrics and write them to InfluxDB for visualization and alerting.
Best Practices for Using Burrow
To maximize the effectiveness of Burrow in monitoring your Kafka infrastructure, consider the following best practices:
Deployment Considerations
-
High Availability : Deploy Burrow with redundancy to avoid monitoring gaps.
-
Resource Allocation : Ensure Burrow has sufficient resources to monitor all your Kafka clusters.
-
Security Configuration : Properly secure Burrow's API endpoints, especially in production environments.
-
Regular Updates : Keep Burrow updated to support newer Kafka versions and fix security vulnerabilities.
Monitoring Strategy
-
Monitor All Consumer Groups : Let Burrow automatically discover and monitor all consumer groups.
-
Focus on Critical Groups : Identify and prioritize consumer groups that are critical to your business.
-
Set Appropriate Window Sizes : Configure evaluation windows based on your message processing patterns.
-
Implement Notification Filters : Avoid alert fatigue by filtering notifications based on consumer group priority.
Integration with Operations
-
Centralize Monitoring : Integrate Burrow with your existing monitoring systems for a unified view.
-
Automate Responses : Where possible, automate responses to common consumer lag issues.
-
Document Recovery Procedures : Create clear documentation for addressing different types of consumer lag problems.
-
Regular Testing : Periodically test your monitoring and alerting setup to ensure it works as expected.
Common Issues and Troubleshooting
Despite its robust design, Burrow users may encounter certain issues that require troubleshooting.
Kafka Version Compatibility
Burrow may stop emitting metrics after Kafka upgrades, as seen in the issue where it stopped working after upgrading from Kafka 3.6.x to 3.7.x. If you experience this:
-
Check that Burrow's
kafka-versionconfiguration matches your actual Kafka version -
Review Burrow logs for errors like "failed to fetch offsets from broker" or "error in OffsetResponse"
-
Restart Burrow to reestablish connections to the Kafka cluster
Consumer Lag Calculation Issues
If Burrow is unable to calculate consumer lag for some topics:
-
Verify that consumers are committing offsets correctly
-
Check if the low water mark is available for the partitions
-
Ensure that Burrow has the necessary permissions to access the
__consumer_offsetstopic
Performance Considerations
For large Kafka deployments with many topics and consumer groups:
-
Limit concurrent connections using the
concurrent_connectionsconfiguration -
Filter which clusters, groups, or topics to monitor using include/exclude patterns
-
Adjust the response timeout to avoid timeouts during heavy load periods
Alternative Monitoring Tools
While Burrow is powerful, other monitoring solutions might better suit specific needs:
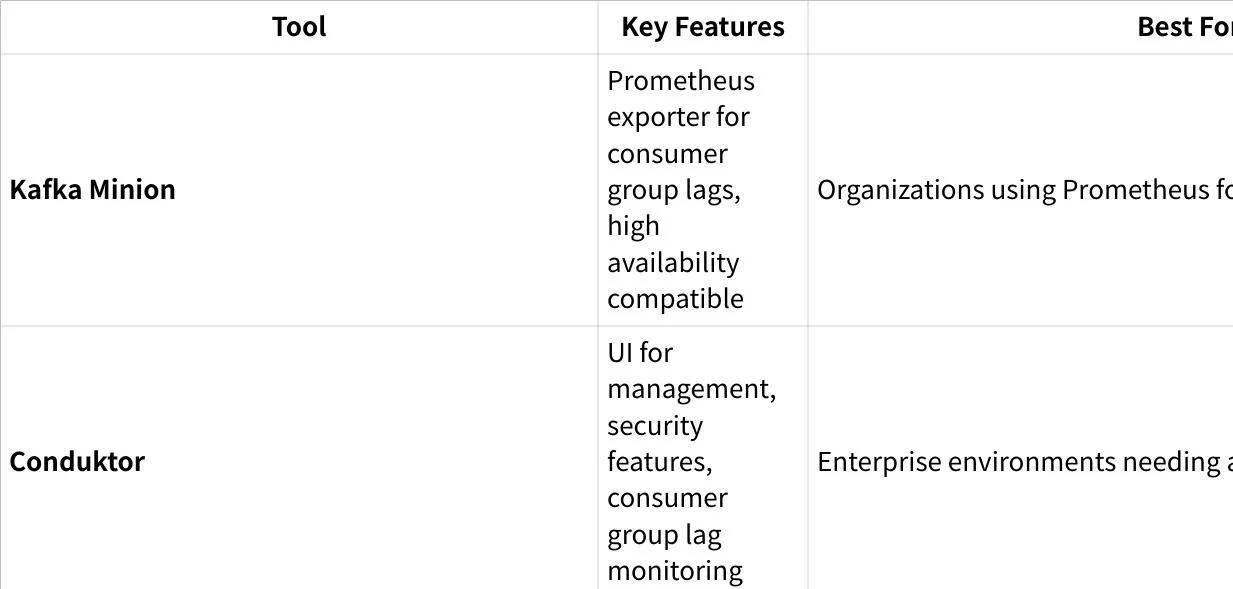
More Kafka tools can be found here: Top 12 Free Kafka GUI Tools 2025
Conclusion
Burrow represents a significant advancement in Kafka monitoring by eliminating arbitrary thresholds and providing a more nuanced view of consumer health. Its modular architecture, robust API, and integration capabilities make it a valuable tool for organizations relying on Kafka for their streaming data needs.
By following the setup procedures, configuration best practices, and integration strategies outlined in this guide, you can leverage Burrow to gain deep insights into your Kafka infrastructure, proactively address consumer lag issues, and ensure the reliability of your streaming data platform.
Whether you're running a small Kafka deployment or managing a large-scale streaming infrastructure, Burrow's objective monitoring approach and flexible configuration options make it an excellent choice for keeping your Kafka ecosystem healthy and performant.
Still struggling with skyrocketing Kafka bills and the "ops tax" of manual disk management? It's time to stop babysitting your clusters. Try AutoMQ Cloud for Free and experience how diskless architecture slashes costs and automates scaling—no credit card required. See how others made the switch in our case studies or explore the project on GitHub.


