Introduction
Apache Kafka has become the de facto standard for real-time data streaming. While its core strength lies in durable and scalable messaging, its power is fully unlocked when you move beyond simple data transport into the realm of stateful stream processing with the Kafka Streams library. Stateful operations, such as aggregations, joins, and windowing, require a mechanism to store and retrieve intermediate state efficiently and reliably.
This is where RocksDB comes in. By default, Kafka Streams uses RocksDB as its embedded, local storage engine for stateful operations. This choice is deliberate, providing high-performance persistence without the overhead of connecting to an external database. However, to build robust and scalable applications, it is crucial to understand how RocksDB works, how it integrates with Kafka Streams, and how to tune it for optimal performance.
This blog post provides a comprehensive guide for software engineers on using and optimizing RocksDB within Kafka Streams. We will explore its core concepts, configuration best practices, and monitoring strategies to help you build stable and performant stream processing applications.
Why Kafka Streams Uses RocksDB
When a Kafka Streams application performs a stateful operation, like counting occurrences of a key in a KTable , it needs to maintain the current count somewhere. Using an external database for every read and update would introduce significant network latency, undermining the goal of low-latency stream processing.
Kafka Streams solves this by using a local state store on the same machine where the application instance is running. RocksDB is the default implementation for persistent state stores because it offers several key advantages:
-
Embedded: It runs as a library within the same process as your application, eliminating network overhead and simplifying deployment.
-
High Performance: It is optimized for fast storage media like SSDs and provides extremely high write and read throughput.
-
Larger-Than-Memory State: RocksDB can seamlessly spill to disk, allowing your application to maintain a state that is much larger than the available RAM.
![RocksDB Overview [12]](/blog/rocksdb-kafka-streams-usage-optimization/1.png)
Of course, storing state locally on a single machine introduces a risk of data loss if that machine fails. Kafka Streams elegantly solves this by integrating local RocksDB stores with Kafka's own replication capabilities. Every update to a RocksDB state store is also sent to an internal, compacted Kafka topic known as a changelog topic. If an application instance fails, a new instance can fully restore the state by replaying the messages from this changelog topic, ensuring no data is lost .
Core RocksDB Concepts for Kafka Users
To effectively tune RocksDB, it's essential to understand its underlying architecture, which is based on a Log-Structured Merge (LSM) Tree. An LSM tree is designed to optimize write performance by converting random writes into sequential writes on disk .
The Write Path
When your Kafka Streams application writes data to a state store, it follows a specific path within RocksDB:
-
MemTable: The write is first added to an in-memory data structure called a
MemTable(or write buffer). This is extremely fast as it's a pure in-memory operation. -
SSTables: Once a
MemTablebecomes full, it is flushed to disk as an immutable (read-only) file called a Sorted String Table (SSTable). These files contain key-value pairs sorted by key.
Compaction
Over time, many SSTables are created. To manage these files, reclaim space from updated or deleted keys, and optimize the structure for efficient reading, RocksDB runs a background process called compaction. It merges multiple SSTables into new ones. Kafka Streams defaults to the Universal Compaction style, which is optimized for high write throughput but can use more disk space. An alternative, Level Compaction, minimizes disk space but may have lower write throughput .
The Read Path
When a key is read, RocksDB checks for it in the following order:
-
The active
MemTable. -
Any immutable
MemTables that have not yet been flushed. -
The on-disk SSTables, from newest to oldest.
To speed this up, RocksDB employs two critical components:
-
Bloom Filters: A probabilistic data structure in memory that can quickly determine if a key might exist in a given SSTable. If the bloom filter says a key is not present, RocksDB can skip reading that file entirely, saving significant I/O.
-
Block Cache: An in-memory cache that holds uncompressed data blocks from SSTables. If a frequently accessed piece of data is in the block cache, RocksDB avoids reading it from disk.
How Kafka Streams Interacts with RocksDB
In Kafka Streams, stateful DSL operators like count() , aggregate() , and reduce() , as well as KTable - KTable joins, are backed by a state store that defaults to RocksDB . Each stream task within an application instance manages its own set of partitions and, consequently, its own independent RocksDB instance for each associated state store.
Kafka Streams also introduces its own in-memory record cache, which sits in front of RocksDB. This cache serves to buffer and batch writes to the underlying store and de-duplicate records before they are written. Its size is controlled by the statestore.cache.max.bytes configuration parameter. While this cache improves performance, the primary memory consumer in a stateful application is typically RocksDB itself.
Configuration and Optimization Best Practices
Out-of-the-box, Kafka Streams' RocksDB configuration is optimized for general-purpose use. However, for production workloads, custom tuning is almost always necessary to ensure stability and performance.
The Number One Challenge: Memory Management
The most common operational issue with RocksDB in Kafka Streams is memory management. In containerized environments like Kubernetes, applications are often terminated with an OOMKilled error. This is frequently caused by a misunderstanding of how RocksDB uses memory.
RocksDB consumes off-heap memory, which is memory allocated outside the Java Virtual Machine (JVM) heap. This means that setting the JVM heap size ( -Xmx ) does not limit RocksDB's memory usage. If left unconstrained, RocksDB can consume more memory than allocated to the container, leading to termination .
The solution is to explicitly limit RocksDB's memory consumption. This is done by implementing the RocksDBConfigSetter interface and passing your custom class name to the rocksdb.config.setter configuration property .
A critical best practice is to configure a shared block cache and write buffer manager across all RocksDB instances within a single application instance. This ensures that you have a single, global memory limit for all state stores, preventing memory contention and over-allocation .
Furthermore, it is highly recommended to use the jemalloc memory allocator instead of the default glibc on Linux. RocksDB's memory allocation patterns can cause fragmentation with glibc , whereas jemalloc is known to handle this much more effectively .
Key Tuning Parameters
You can set the following RocksDB options within your RocksDBConfigSetter implementation.
| Parameter | RocksDB Option | Description & Tuning Advice |
|---|---|---|
| Write Buffer Size | options.setWriteBufferSize(long size) | Size of a single MemTable. Larger sizes can absorb more writes before flushing, reducing I/O, but increase memory usage. |
| Write Buffer Count | options.setMaxWriteBufferNumber(int count) | Maximum number of MemTables (both active and immutable). If this limit is hit, writes will stall. Increasing this can smooth out write bursts but consumes more memory. |
| Block Cache Size | lruCache = new LRUCache(long size) | Size of the shared block cache. This is often the largest memory consumer. Its size should be based on your available off-heap memory and workload's read patterns. |
| Compaction Threads | options.setIncreaseParallelism(int threads) | Number of background threads for compaction. If you see frequent write stalls, increasing this can help, but it will use more CPU. |
| Max Open Files | options.setMaxOpenFiles(int count) | The maximum number of file handles RocksDB can keep open. The default of -1 means unlimited. If you hit OS file handle limits, you may need to set this to a specific value . |
Hardware and Operational Considerations
-
Use Fast Storage: Always use SSDs or NVMe drives for the directory specified by
state.dir. RocksDB's performance is highly dependent on fast disk I/O. -
Limit State Stores Per Instance: Avoid running too many stateful tasks (and thus RocksDB instances) on a single application instance. This can lead to heavy resource contention. A common recommendation is to keep the number of state stores under 30 per instance and scale out the application if necessary .
-
Use Standby Replicas: Configure
num.standby.replicas=1or higher. Standby replicas are shadow copies of a state store on other instances. If an active task fails, a standby can be promoted almost instantly, dramatically reducing recovery time .
Monitoring RocksDB in Kafka Streams
Effective tuning is impossible without good monitoring. Kafka Streams exposes a wealth of RocksDB metrics via JMX, which can be scraped by monitoring tools like Prometheus .
| Metric Name (via JMX) | What It Indicates |
|---|---|
| size-all-mem-tables | Total off-heap memory used by all MemTables. A key indicator of write pressure. |
| block-cache-usage | Total off-heap memory used by the shared block cache. |
| block-cache-hit-ratio | The percentage of reads served from the block cache. A low ratio may indicate the cache is too small for your workload. |
| write-stall-duration-avg | Average duration of write stalls. Non-zero values indicate RocksDB cannot keep up with the write rate and is throttling the application. |
| bytes-written-compaction-rate | The rate of data being written during compaction. High values indicate heavy I/O from background compaction work. |
| estimate-num-keys | An estimate of the total number of keys in the state store. Useful for understanding state size. |
Challenges and Advanced Concepts
While powerful, the embedded RocksDB model has challenges. The most significant is the potential for long state restoration times. When an application restarts without a persistent volume or after an unclean shutdown, it must rebuild its entire RocksDB state from the Kafka changelog topic. For very large state stores, this can take hours . This underscores the importance of using standby replicas and, where possible, persistent volumes for the state.dir .
An advanced RocksDB feature worth noting is Tiered Storage. This experimental feature allows RocksDB to classify data as "hot" or "cold" and store it on different storage tiers (e.g., hot data on NVMe, cold data on spinning disks). For time-series data common in Kafka Streams, this is conceptually a perfect fit, but it is not yet a mainstream, documented best practice within the Kafka Streams community .
Conclusion
RocksDB is the high-performance engine that powers stateful processing in Apache Kafka Streams. Its embedded, write-optimized LSM-tree architecture provides the speed and scalability needed for demanding real-time applications.
However, treating it as a black box can lead to significant operational issues, particularly with memory management. Effective optimization hinges on understanding its core principles, carefully managing its off-heap memory usage via a RocksDBConfigSetter , and actively monitoring key performance metrics. By applying the best practices outlined in this article, you can harness the full power of RocksDB to build robust, scalable, and highly performant stateful streaming applications with Apache Kafka.
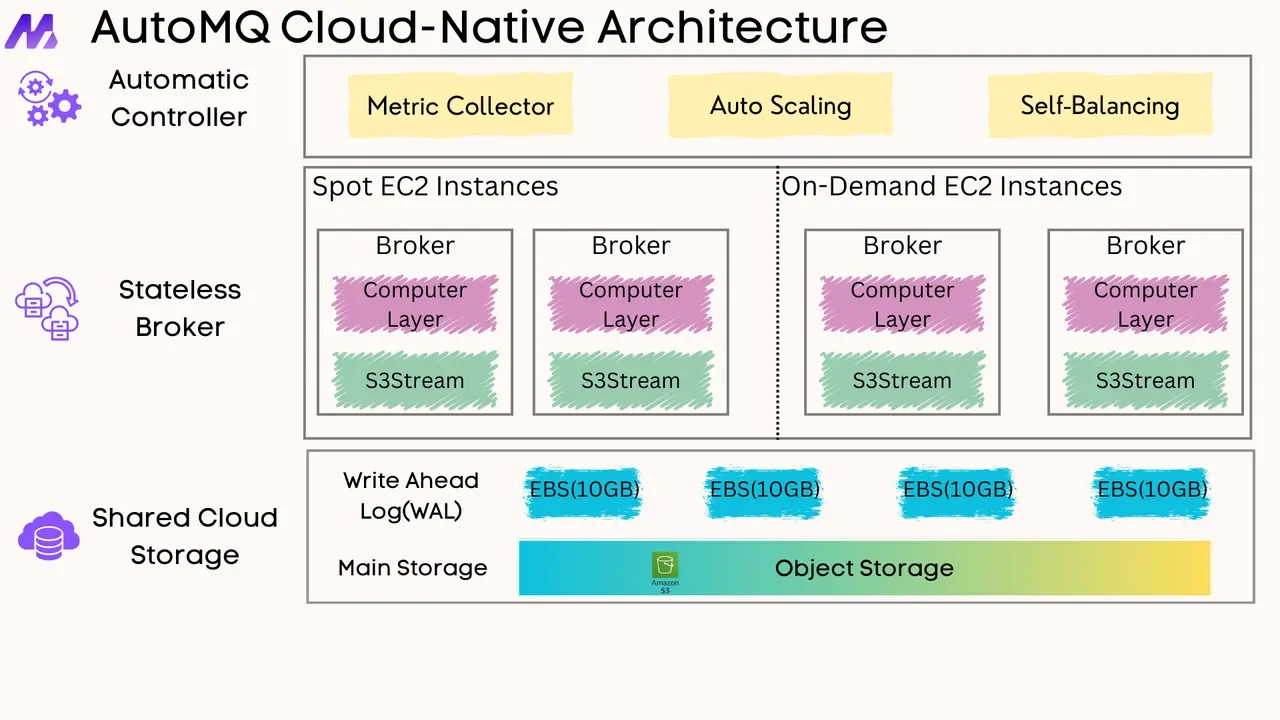
If you find this content helpful, you might also be interested in our product AutoMQ. AutoMQ is a cloud-native alternative to Kafka by decoupling durability to S3 and EBS. 10x Cost-Effective. No Cross-AZ Traffic Cost. Autoscale in seconds. Single-digit ms latency. AutoMQ now is source code available on github. Big Companies Worldwide are Using AutoMQ. Check the following case studies to learn more:
-
Grab: Driving Efficiency with AutoMQ in DataStreaming Platform
-
Palmpay Uses AutoMQ to Replace Kafka, Optimizing Costs by 50%+
-
How Asia’s Quora Zhihu uses AutoMQ to reduce Kafka cost and maintenance complexity
-
XPENG Motors Reduces Costs by 50%+ by Replacing Kafka with AutoMQ
-
Asia's GOAT, Poizon uses AutoMQ Kafka to build observability platform for massive data(30 GB/s)
-
AutoMQ Helps CaoCao Mobility Address Kafka Scalability During Holidays
-
JD.com x AutoMQ x CubeFS: A Cost-Effective Journey at Trillion-Scale Kafka Messaging

