.png)
Overview
Apache Kafka has become a cornerstone of modern data architectures, enabling real-time data streaming for countless applications, from event-driven microservices to large-scale analytics. However, managing the capacity of a Kafka cluster effectively is a significant challenge. Teams often grapple with two opposing problems: overprovisioning, which leads to wasted resources and inflated costs, and underprovisioning, which can cripple performance and stability. Achieving the right balance is crucial for a healthy, efficient, and cost-effective Kafka deployment.
This blog post delves into the complexities of Kafka overprovisioning and underprovisioning. We'll explore their definitions, impacts, and common causes. More importantly, we'll outline key metrics for identification and provide actionable strategies and best practices to help you navigate these challenges and optimize your Kafka clusters.
Understanding Kafka Provisioning Challenges
Provisioning a Kafka cluster involves allocating the necessary resources—brokers, CPU, memory, storage, and network bandwidth—to meet current and future workload demands. Getting this wrong can lead to significant operational headaches.
What is Overprovisioning?
Overprovisioning occurs when a Kafka cluster is allocated significantly more resources than it actually needs to handle its current and foreseeable workload [1, 2]. This is often a result of conservative planning, a "better safe than sorry" approach to avoid performance issues, or the difficulty in accurately predicting peak loads.
Impacts:
Wasted Expenditures: The most direct impact is financial. Paying for idle compute, storage, and network capacity can substantially inflate operational costs, especially in cloud environments [2].
Low Resource Utilization: Valuable resources sit idle, leading to poor efficiency and a lower return on investment.
Increased Operational Overhead: Larger-than-necessary clusters can still require management, monitoring, and maintenance efforts, even for underutilized components.
Common Causes:
Anticipating worst-case peak demand that rarely materializes [2].
Difficulty in dynamically scaling traditional Kafka setups, leading to provisioning for the highest conceivable load.
Lack of precise workload understanding or forecasting capabilities.
A history of performance issues leading to a culture of excessive buffering.
<img alt="Kafka Overprovisioning [41]" src="https://webflow-prod-assets.s3.amazonaws.com/67480fef30f9df5f84f31d36%2F685e632f293bf733dc6acec0_m7gU.png"width="80%" />
What is Underprovisioning?
Underprovisioning is the flip side: allocating insufficient resources to the Kafka cluster to adequately handle the actual workload [2, 18]. This might happen due to budget constraints, underestimation of growth, or sudden, unexpected surges in traffic.
Impacts:
Performance Degradation: This is often the first symptom, manifesting as increased latency, reduced throughput, and slower message processing [2, 18].
Instability and Downtime: Severe underprovisioning can lead to broker failures, frequent leader re-elections, and even cluster-wide outages, impacting mission-critical applications [20, 18].
Data Loss Risk: In extreme cases, if brokers crash before data is fully replicated or if consumers cannot keep up and data retention limits are hit, there's a risk of data loss.
Increased Pager Alerts & Firefighting: Operations teams are constantly battling performance issues and outages [2].
Common Causes:
Unforeseen viral events or sudden business growth leading to traffic spikes [12].
Rapid addition of new services or applications producing/consuming data.
Inefficient client configurations (producers/consumers) or suboptimal broker settings.
Hardware limitations becoming bottlenecks as load increases [8].
Slow consumers that cannot keep pace with producer rates, leading to growing lag and resource pressure [12, 22].
![Kafka Underprovisioning [41]](https://static-file-demo.automq.com/6809c9c3aaa66b13a5498262/68f5ec14f4aa6742a902fa79_67480fef30f9df5f84f31d36%252F685e6330454fab1b0a3e1448_ZQxp.png)
Key Metrics for Identifying Provisioning Issues
Effective monitoring is the first line of defense. Tracking the right Key Performance Indicators (KPIs) can help you detect signs of both overprovisioning and underprovisioning early [16, 32].
Broker Metrics:
CPU Utilization: Consistently very low CPU usage (<20-30%) might indicate overprovisioning, while sustained high CPU usage (>70-80%) is a strong sign of underprovisioning [1, 32].
Memory Usage: Similar to CPU, monitor heap usage and page cache effectiveness. OutOfMemory errors are a critical sign of underprovisioning.
Disk I/O Utilization & Disk Space: High I/O wait times, queue depths, or rapidly filling disks indicate potential underprovisioning or storage bottlenecks. Conversely, vast amounts of unused disk space over long periods might suggest overprovisioned storage [1, 32].
Network Throughput (BytesInPerSec, BytesOutPerSec): Compare actual throughput against provisioned capacity. Consistently low utilization signals overprovisioning; saturation points to underprovisioning [12, 32].
Request Latency (Produce, Fetch): Increasing request latencies are often early indicators of brokers struggling to keep up, a symptom of underprovisioning [12].
Request Queue Size: Growing request queues mean brokers can't process requests as fast as they arrive, a clear sign of underprovisioning [33].
Under-Replicated Partitions: A non-zero count indicates that some data is not fully replicated, potentially due to an overloaded or failed broker, often linked to underprovisioning [12, 30].
Offline Partitions Count: Signals partitions without an active leader, making data unavailable, a critical issue often stemming from broker failures due to underprovisioning [30].
Producer Metrics:
Record Send Rate & Error Rate: Low send rates despite high demand or high error rates can signal issues.
Request Latency: High producer latency indicates brokers are slow to acknowledge messages [12].
Consumer Metrics:
Consumer Lag: This is a critical metric. Persistently high or growing lag per partition indicates consumers cannot keep up with producers, a common symptom of underprovisioned consumers or an overwhelmed cluster [12, 22].
Records Consumed Rate: If this rate is consistently lower than the produce rate, lag will build up [12].
Rebalance Frequency/Duration: Frequent or lengthy rebalances can disrupt consumption and might be exacerbated by an unstable or under-resourced cluster.
Operating System Metrics: Monitor system-level load, network errors, and disk health on broker machines.
Strategies to Solve Kafka Overprovisioning
Addressing overprovisioning primarily revolves around optimizing resource usage and aligning capacity more closely with actual needs.
Right-Sizing and Proactive Capacity Planning
Detailed Workload Analysis: Understand your message sizes, throughput patterns (peak vs. average), data retention requirements, and growth projections.
Benchmarking: Before deploying or scaling, benchmark your Kafka cluster with realistic workloads to understand its performance characteristics and limits under various configurations [26].
Regular Reviews: Periodically review resource utilization metrics to identify and reclaim overprovisioned resources.
Cost Optimization Techniques
Data Compression: Enable compression on producers (
compression.type) to reduce message size, leading to lower network bandwidth usage and storage footprint [11, 38]. Choose codecs like Snappy, LZ4, or ZSTD based on your workload's CPU vs. compression ratio trade-off [11].Tiered Storage: For long-term data retention, consider solutions that move older, less frequently accessed data to cheaper object storage, keeping only recent data on expensive local broker storage. This can significantly reduce storage costs [15, 25, 39].
Clean Up Inactive Resources: Regularly identify and remove unused topics or partitions that consume disk space and metadata overhead [15].
Optimize Broker Instance Types: Choose instance types (if in the cloud) that match your workload profile (e.g., memory-optimized, storage-optimized, network-optimized) rather than general-purpose instances that may be over-specced in some dimensions.
Monitoring and Automation for Efficiency
Continuous Monitoring: Implement robust monitoring to track resource utilization trends and identify periods of low usage where capacity could potentially be reduced [16].
Partition Rebalancing Tools: When adding or removing brokers, partitions are not automatically rebalanced. Certain open-source tools can help analyze the cluster and propose or execute partition reassignments for optimal load distribution, preventing some brokers from being underutilized while others are overutilized post-scaling [19].
Autoscaling (where available): Some managed Kafka services or Kubernetes-based deployments offer autoscaling capabilities. These solutions can automatically adjust cluster resources based on demand, minimizing both over and underprovisioning [2, 28, 29].
Strategies to Solve Kafka Underprovisioning
Combating underprovisioning involves a multi-pronged approach of scaling resources, optimizing configurations, and ensuring efficient data flow.
Scaling Strategies
Horizontal Scaling: Add more brokers to the cluster to distribute the load and increase overall capacity for throughput, storage, and request handling [37]. Remember to rebalance partitions after adding brokers [19].
Vertical Scaling: Increase the resources (CPU, RAM, disk I/O capacity) of existing brokers. This can be quicker for immediate relief but has limits and might require downtime [37].
Consumer Scaling: Increase the number of consumer instances within a consumer group up to the number of partitions for a topic to improve parallel processing and reduce lag [12, 22].
Performance Tuning
Broker Configuration
num.network.threads: Number of threads handling network requests. Increase if network processing is a bottleneck [8, 23].num.io.threads: Number of threads for disk I/O. Increase if disk operations are slow [8, 23].socket.send.buffer.bytes/socket.receive.buffer.bytes: Adjust socket buffer sizes for network requests [8, 23].Log segment size (
log.segment.bytes) and retention settings (log.retention.ms/bytes): Optimize for storage and cleanup efficiency [10].Replication settings: Ensure
min.insync.replicasis appropriately set for your durability and availability needs [7, 21].
Producer Configuration
Batching: Tune
batch.size(max bytes per batch) andlinger.ms(max time to wait before sending a batch) to increase throughput by sending larger, less frequent batches. This can reduce network overhead and broker load but may increase latency [10, 38, 40].Compression: As with overprovisioning, enabling compression (
compression.type) reduces data size, easing network and broker load [38].Acknowledgments (
acks): Settingacks=1offers lower latency thanacks=allbut with slightly lower durability guarantees. Choose based on your data's criticality [23].Asynchronous Sending: Use non-blocking send calls with callbacks for better producer performance.
Consumer Configuration
Workspace.min.bytes/Workspace.max.wait.ms: Controls how much data the consumer fetches and how long it waits. Tuning these can optimize the number of fetch requests [22, 39].max.poll.records: Maximum records returned in a single poll. Adjust based on processing capacity [22, 39].max.poll.interval.ms: Maximum time between polls before a consumer is considered dead. Ensure your processing completes within this interval [39].Processing Logic Efficiency: Optimize the code within your consumers that processes messages. Slow processing is a major cause of consumer lag [12].
Partition Management
Optimal Partition Count: Choose an appropriate number of partitions per topic. Too few can limit parallelism; too many can increase overhead on brokers and the controller [1, 20, 35]. Consider throughput needs and consumer parallelism [1].
Partition Key Strategy: Use message keys effectively to ensure even data distribution across partitions and maintain order for related messages. Avoid keys that cause "hot" partitions [14, 20].
Rebalancing: Actively rebalance partitions when scaling the cluster or if significant skew is detected [19, 30].
Addressing System Bottlenecks
Hardware Upgrades: If software tuning isn't enough, upgrade to faster CPUs, add more RAM (especially for page cache), use SSDs for lower disk latency, and improve network bandwidth [8].
Operating System Tuning: Optimize OS-level settings like file descriptor limits and TCP parameters.
JVM Tuning: For Kafka brokers (and Java clients), tune JVM heap size, garbage collection algorithms, and other parameters to optimize performance and prevent long GC pauses [8, 13].
Proactive Best Practices for Balanced Kafka Provisioning
Preventing provisioning issues is always better than reacting to them.
Comprehensive Monitoring and Alerting: Implement thorough monitoring for all key Kafka and system metrics. Set up meaningful alerts with appropriate thresholds to get notified of impending issues before they impact users [12, 16, 27, 30].
Regular Capacity Reviews and Forecasting: Don't treat capacity planning as a one-time task. Regularly review utilization trends, forecast future load based on business growth, and adjust capacity proactively [1].
Automate Where Possible: Leverage automation for deployment, configuration management, and scaling (e.g., using Infrastructure as Code, Kubernetes operators, or managed service features) [28, 29].
Define and Enforce Data Retention Policies: Manage disk usage effectively by setting appropriate retention periods based on data value and compliance requirements [15].
Continuous Performance Testing: Regularly conduct performance tests, especially before releasing new applications or anticipating load changes, to understand capacity limits and identify bottlenecks [26].
Understand Core Kafka Concepts: A solid understanding of Kafka's architecture—including broker internals [5, 31], replication mechanisms [7, 21, 36], the leader election process [4], consumer group behavior [8, 29], and the role of metadata management (ZooKeeper/KRaft) [9, 34]—is invaluable for making informed provisioning and tuning decisions.
Conclusion
Solving Kafka overprovisioning and underprovisioning is an ongoing balancing act that requires diligence, understanding, and the right tools. By implementing robust monitoring, engaging in proactive capacity planning, and applying targeted optimization strategies for your brokers, producers, and consumers, you can achieve a Kafka deployment that is not only performant and stable but also cost-effective. The journey to an optimally provisioned Kafka cluster involves continuous learning and adaptation to your evolving data landscape.
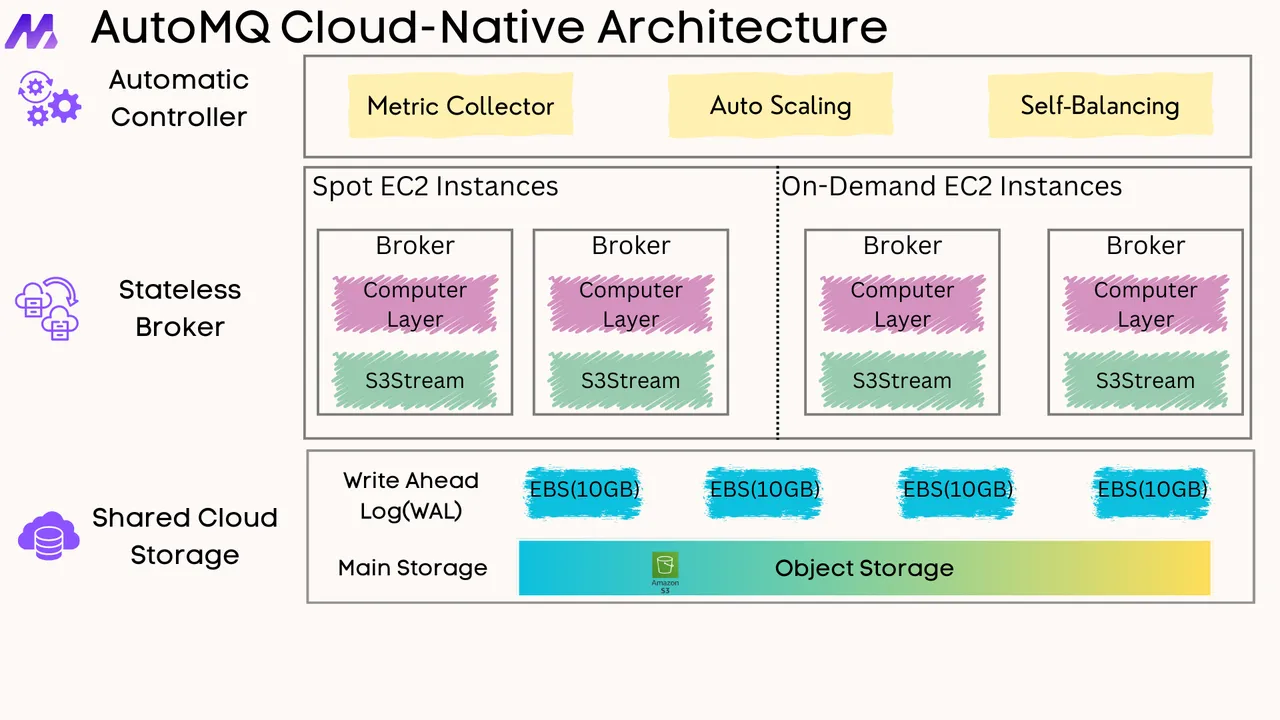
If you find this content helpful, you might also be interested in our product AutoMQ. AutoMQ is a cloud-native alternative to Kafka by decoupling durability to S3 and EBS. 10x Cost-Effective. No Cross-AZ Traffic Cost. Autoscale in seconds. Single-digit ms latency. AutoMQ now is source code available on github. Big Companies Worldwide are Using AutoMQ. Check the following case studies to learn more:
Grab: Driving Efficiency with AutoMQ in DataStreaming Platform
Palmpay Uses AutoMQ to Replace Kafka, Optimizing Costs by 50%+
How Asia’s Quora Zhihu uses AutoMQ to reduce Kafka cost and maintenance complexity
XPENG Motors Reduces Costs by 50%+ by Replacing Kafka with AutoMQ
Asia's GOAT, Poizon uses AutoMQ Kafka to build observability platform for massive data(30 GB/s)
AutoMQ Helps CaoCao Mobility Address Kafka Scalability During Holidays
JD.comx AutoMQ x CubeFS: A Cost-Effective Journey at Trillion-Scale Kafka Messaging
References
Kafka Topics Choosing the Replication Factor and Partitions Count - Conduktor
Serverless Decoded: Reinventing Kafka Scaling with Elastic CKUs - Confluent
The Cost of Apache Kafka: An Engineer's Guide to DIY Kafka Pricing - Confluent
Kafka Replication and Committed Messages - Confluent Documentation
Implementing event-driven architectures with Apache Kafka - Redpanda
A Deep Dive into Apache Kafka: Challenges and Solutions - RisingWave
A Deep Dive into Apache Kafka's Advanced Capabilities - CelerData
Recommended data compression algorithms--Message Queue for Kafka-Byteplus
Common Kafka Cluster Management Pitfalls and How to Avoid Them - meshIQ
How Optimizing Kafka Can Save Costs of the Whole System | GlobalDots
Kafka cluster architecture—An in-depth guide for data engineers - Redpanda
Troubleshooting Kafka Common Issues and Their Resolutions - Scaler Topics
Charmed Apache Kafka K8s Documentation - Tutorial Rebalance and Reassign Partitions
Top 10 Kafka Configuration Tweaks for Better Performance - meshIQ
Kafka benchmark—Use cases, examples, and alternatives - Redpanda
Kafka Scaling Trends for 2025: Optimizations and Strategies - meshIQ
Understanding Kafka Broker Architecture - Confluent Developer
How REA Group approaches Amazon MSK cluster capacity planning | AWS Big Data Blog
Achieving relentless Kafka reliability at scale with the Streaming Platform | Datadog
Zookeeper to Kraft Migration - Acceldata Open-Source Data Platform
Intra-Cluster Replication in Apache Kafka - LinkedIn Engineering
Chapter 5. Kafka producer configuration tuning | Red Hat Product Documentation
How to Configure Apache Kafka for Better Throughput and Lower Latency