
Metrics Collection and Application Principles
Internal components of AutoMQ support the collection of various Kafka Server Metrics data. However, the current business edition does not provide built-in Metrics dashboards and monitoring alert capabilities. Users can implement custom Metrics monitoring and analysis based on the integration features provided by AutoMQ. The overall architecture is referenced in the diagram below: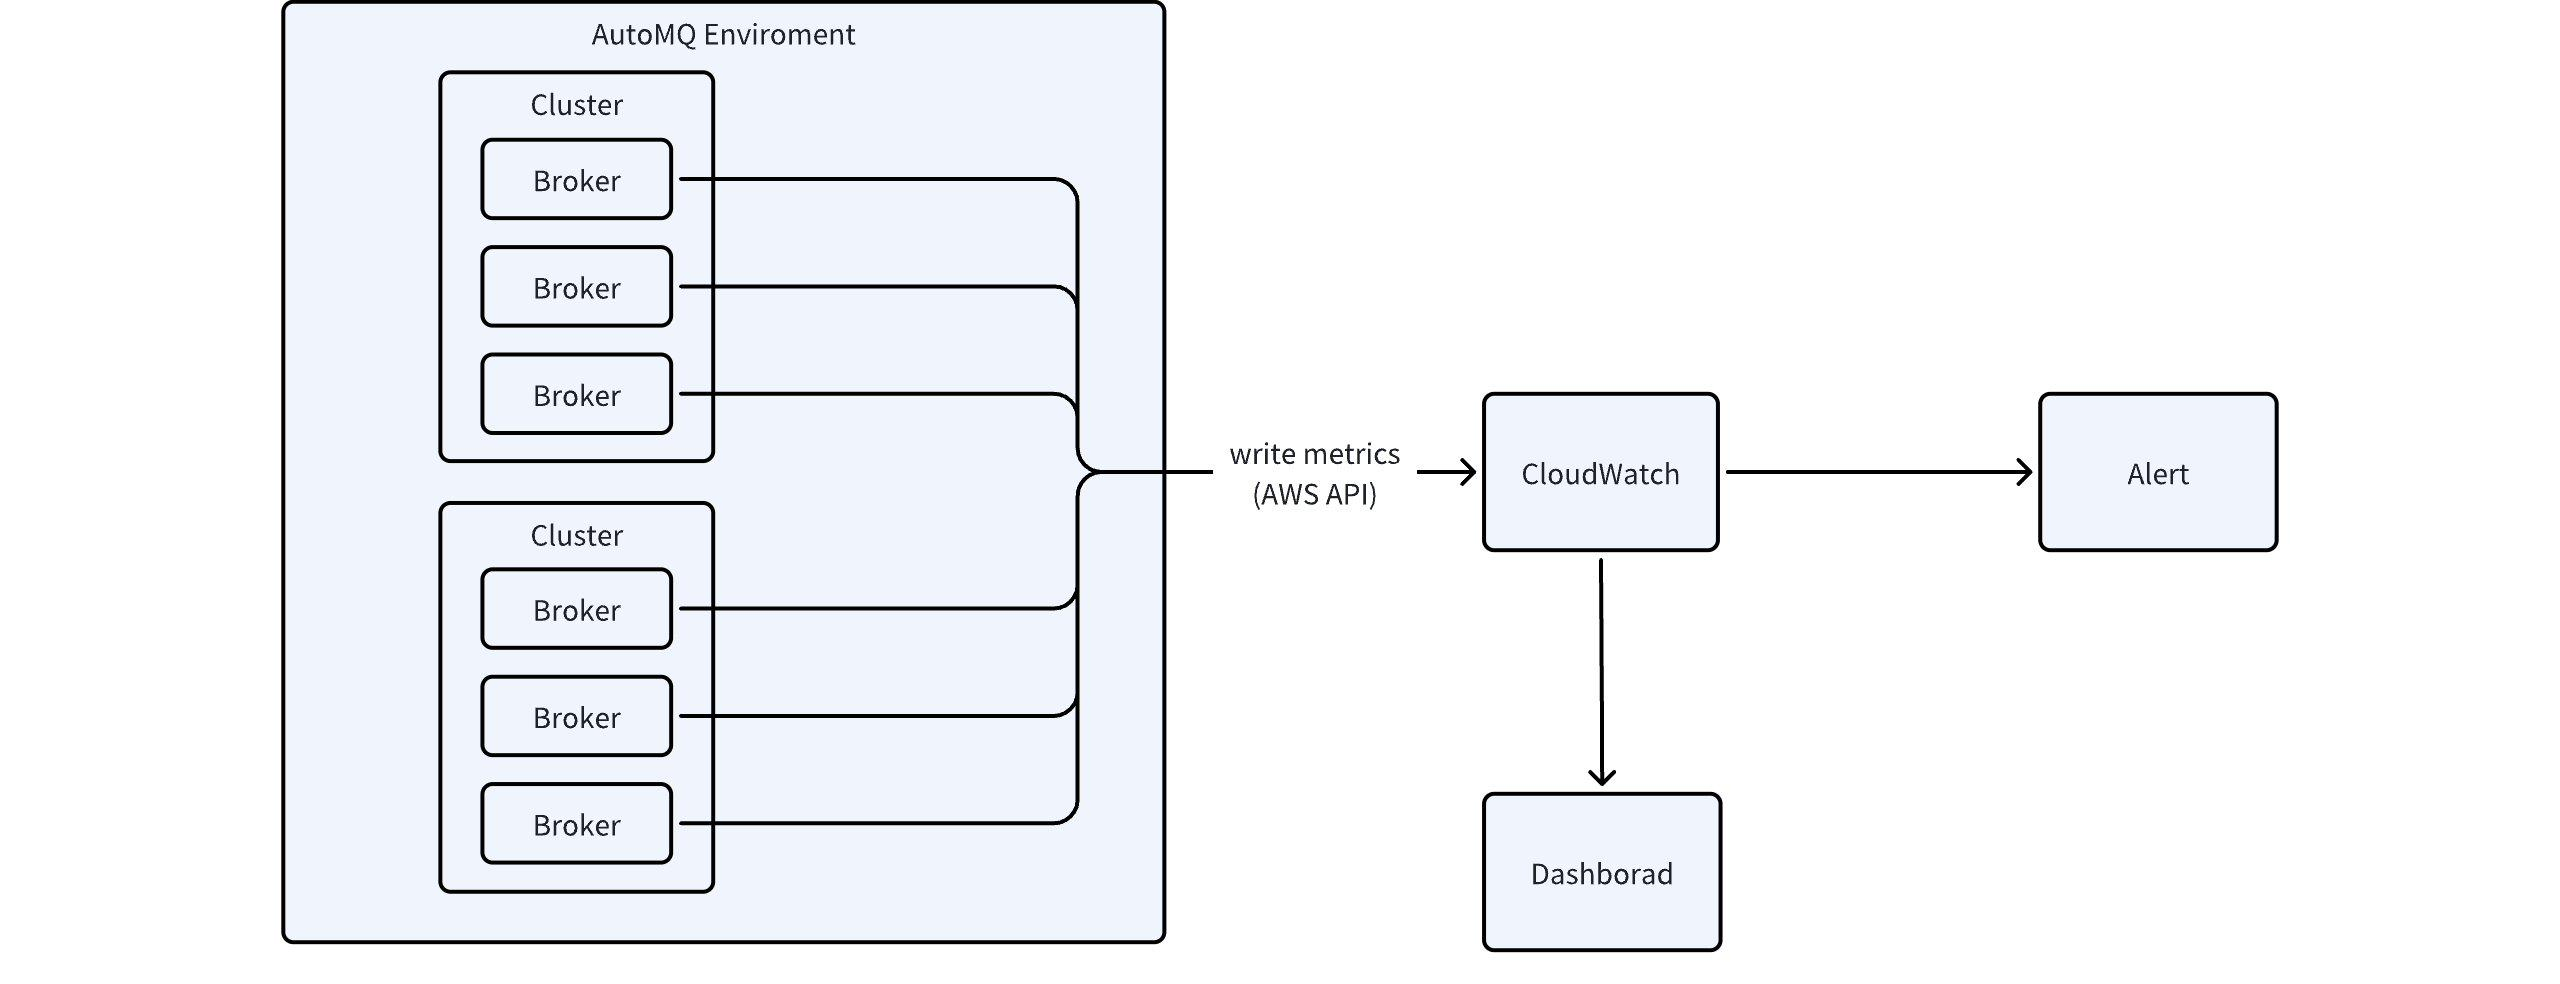
CloudWatch Metrics Definition
Detailed definitions of the relevant Metrics exposed through the above integration are as follows:| Metric Name | Metric Description |
|---|---|
| kafka_controller_active_count |
|
| kafka_network_io_bytes_in_sec |
|
| kafka_network_io_bytes_out_sec |
|
| kafka_server_connection_count |
|
| kafka_partition_total_count |
|
| kafka_topic_count |
|
| kafka_consume_offset_lag |
|
| kafka_message_count_in_sec |
|
| kafka_partition_offline_count |
|
| kafka_log_size |
|